Hello! Welcome to the first lesson in our module on Venture Finance and Valuation.
In the previous module, we established the legal and regulatory framework for your accelerator, culminating in how to protect your own valuable intellectual property. Now, we pivot from the legal structure of your firm to the financial health of the startups you'll be evaluating.
Your experience in business model validation and product-market fit gives you a strong foundation for assessing a startup's strategy. However, as an investor, you must also be able to quickly read its financial vital signs. This lesson provides the first and most fundamental tool for that diagnosis.
Today, we will focus on how to interpret key metrics from a startup's financial statements to assess health, specifically its burn rate and runway. By the end of this lesson, you will be able to calculate these metrics and, more importantly, understand what they signal about a company's stability and fundraising needs. This is the first financial filter you'll apply to any potential investment.
1. The Two Most Important Vital Signs: Burn Rate and Runway
Imagine a startup's bank account is its fuel tank. Burn rate is the speed at which it's consuming fuel, and runway is the distance it can travel before the tank is empty. For a pre-revenue or early-stage startup, these are often the most critical indicators of survival.
Let's start by clearly defining these terms and the important distinction between "gross" and "net" burn.
What is startup burn rate and what are mistakes to avoid?
The article 'What is startup burn rate and what are mistakes to avoid?' from Brex provides clear, practical definitions. We will also use 'Startup Burn Rate and Cash Runway' by Startup-Movers to reinforce these concepts with a helpful comparison table.
Please read the section titled 'Types of burn rate your startup should monitor' in the Brex article. Focus on understanding the difference between Gross Burn Rate and Net Burn Rate.
As you've just read, the two key types are:
- Gross Burn Rate: The total cash a company spends in a month on operating expenses (salaries, rent, marketing, etc.) before accounting for any revenue. It tells you the total cost of running the business.
- Net Burn Rate: The actual amount of cash a company loses each month after accounting for revenue and other cash inflows. This is the true rate at which the company's cash balance is shrinking.
When an investor asks, "What's your burn?", they almost always mean the Net Burn Rate. This is the number that matters most for survival.
The relationship between these concepts is visualized well in the chart below. "Cash Expenses" (OPEX + CAPEX) represent your Gross Burn. When you subtract "Cash Sales" (revenue), you get the "Net Burn."
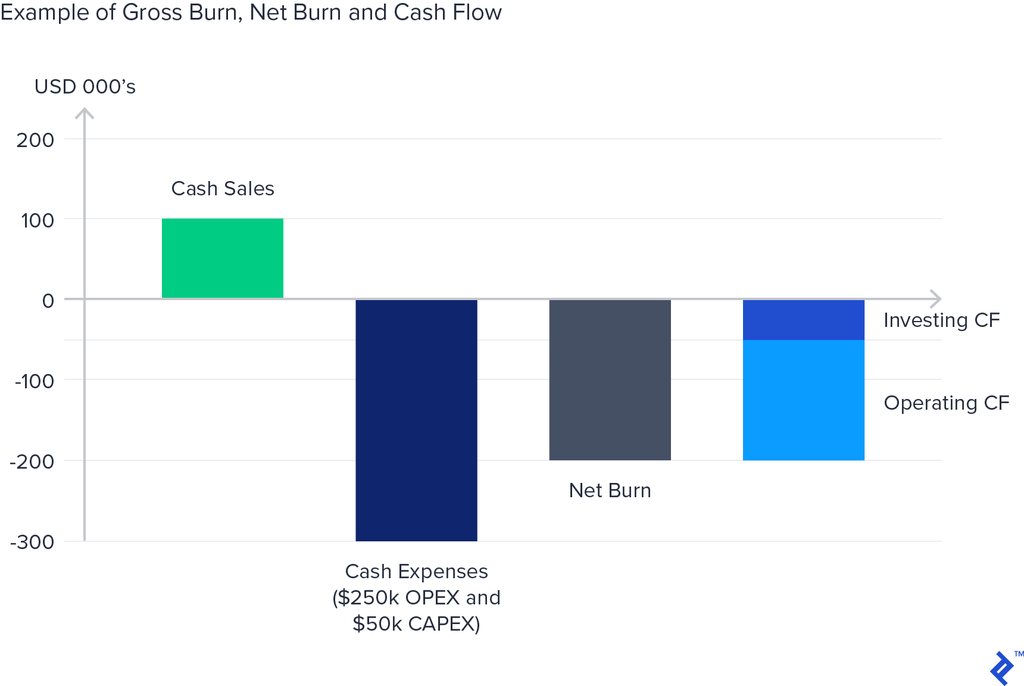
Runway is directly calculated from the Net Burn Rate. It tells you how many months the company can continue to operate before it runs out of money, assuming the burn rate and revenue remain constant.
The formulas are straightforward:
- Net Burn Rate = (Monthly Cash Outflows) – (Monthly Cash Inflows)
- Runway = (Total Cash in Bank) / (Net Burn Rate)
2. How to Calculate Burn Rate and Runway
While the formulas are simple, the accuracy of your calculation depends on using the right data. A common mistake for beginners is to look at a company's Profit & Loss (P&L) statement. However, a P&L can include non-cash items (like depreciation) and revenue that hasn't been collected yet (accounts receivable).
The correct place to find this information is the Statement of Cash Flows or by directly analyzing the company's bank statements. You are interested in the actual movement of cash.
Let's walk through the process with a practical guide and example.
What is startup burn rate and what are mistakes to avoid?
The same Brex article offers an excellent step-by-step guide and a worked example for calculating these metrics.
Please read the sections 'How to calculate burn rate effectively' and 'A startup burn rate example to learn from'. Pay close attention to the data sources mentioned (cash flow data) and how the runway is derived from the burn rate.
The image below provides a powerful visualization of this in action. You can see the monthly spend and burn, and how the cash balance (the red line) steadily declines over time until it hits the "Cash out" date. This date is the end of the runway.

Test your understanding!
You are evaluating a SaaS startup for your accelerator. They provide you with the following figures for the last quarter:
- Cash in bank at start of quarter: $950,000
- Total expenses paid over 3 months: $450,000
- Total cash from customer subscriptions over 3 months: $150,000
- New investment received during the quarter: $0
Calculate the startup's average monthly net burn and its current runway in months.
Show answer
-
Calculate Total Net Burn over the quarter:
- Total Cash Out ($450,000) - Total Cash In ($150,000) = $300,000
-
Calculate Average Monthly Net Burn:
- Total Net Burn ($300,000) / 3 months = $100,000 per month
-
Calculate Current Cash Balance:
- Starting Cash ($950,000) - Total Net Burn ($300,000) = $650,000
-
Calculate Runway:
- Current Cash Balance ($650,000) / Monthly Net Burn ($100,000) = 6.5 months
An investor would see this 6.5-month runway as a significant risk, indicating an urgent need for fundraising or cost reduction.
3. Interpreting the Numbers: What Is a "Good" Burn Rate?
Calculating the numbers is the easy part. Your value as an investor comes from interpreting them. So, what is a "good" or "acceptable" burn rate?
The answer is: it depends. There is no universal number. A high burn rate isn't automatically bad, and a low burn rate isn't automatically good. Context is everything.
What is startup burn rate and what are mistakes to avoid?
This section from the Brex article explains the contextual factors that determine whether a burn rate is acceptable.
Read the section 'What is an acceptable burn rate?'. Focus on how stage, industry, and market conditions influence investor tolerance for burn.
The key factors to consider are:
- Stage of the Company: An early-stage, pre-seed startup is expected to have a significant burn as it invests heavily in product development and finding product-market fit. A later-stage company nearing profitability is held to a different standard.
- Use of Funds: Are they burning cash on smart investments that fuel growth (e.g., hiring critical engineers, effective marketing campaigns), or is the spending inefficient and unfocused? This is often referred to as "good burn" vs. "bad burn."
- Market Conditions: When capital is easy to raise, investors may tolerate higher burn rates in exchange for rapid growth. In tight financial markets, the focus shifts to capital efficiency and extending runway.
Because "good burn" is so contextual, investors often use runway as the more reliable benchmark.
Startup Metrics & KPIs | Top 10 Metrics Used by VCs
In this short clip, VC Eric Andrews explains why burn rate and runway are so critical from an investor's point of view, directly linking runway to fundraising timelines.
Please watch this section (00:24:41 - 00:26:09). Note the emphasis he places on fundraising taking up to six months, which makes runway a critical planning tool.
As the video highlights, fundraising is a long process. A startup can't wait until it has only 2-3 months of cash left. A healthy runway provides the time needed to hit key milestones and raise the next round from a position of strength, not desperation.
General Guidelines for Runway:
- Danger Zone: Less than 6 months. This signals immediate and urgent problems.
- Caution Zone: 6-12 months. Fundraising should be a top priority.
- Healthy: 12-18 months. This is a common target for venture-backed startups.
- Excellent/Safe: 18-24+ months. This provides a significant buffer against unforeseen challenges or a tough fundraising market.
Conclusion
You have now learned to calculate and interpret the most fundamental financial metrics for any early-stage company. Understanding burn rate and runway allows you to perform a rapid-but-powerful health assessment on any potential investment.
Key Takeaways:
- Net Burn Rate is Key: It represents the true monthly cash loss and is the primary driver of a startup's financial survival clock. It's calculated as
Cash Outflows - Cash Inflows. - Runway is the Ultimate Benchmark: It measures time to cash-out (
Total Cash / Net Burn). A healthy runway of 12-18 months is a standard goal for most early-stage companies. - Context is Everything: An "acceptable" burn rate depends on the startup's stage, industry, and the broader economic climate. Your job is to assess if the burn is fueling efficient growth or just waste.
- Think Like an Investor: A short runway is a major red flag because it limits a startup's options and dramatically increases the risk for investors.
Preview of the next lesson:
Knowing a startup's runway tells us about its survival timeline. But it doesn't tell us if the business model itself is efficient or sustainable. In our next lesson, we will go one layer deeper by learning to evaluate a startup's viability using unit economics, specifically Customer Acquisition Cost (CAC) and Lifetime Value (LTV). This will help you answer the question: "Is this a business that can ever become profitable?"