
In our last lesson, we explored the UML component view, examining how a single application or service can be broken down into its logical building blocks. This gave us a "Level 3" view in the C4 model, looking inside one of the system's containers. Now, we'll take a step back to address the physical topology of our system.
This lesson focuses on constructing a UML deployment view. This diagram type answers the question: "Where does our software actually run?" You will learn to map deployable software units, called artifacts, onto the hardware and software infrastructure that executes them. We'll explore the standard UML notation for this and then translate it into practice using Mermaid's powerful (and very new) architecture diagram type, making sure to document any gaps between the formal UML and our practical implementation.
From Logical Components to Physical Deployment
A deployment diagram shows the static runtime configuration of a system. While a component diagram shows logical groupings of code, a deployment diagram shows how the outputs of your build process—executables, libraries, web archives—are placed onto physical or virtual machines and how those machines connect. Given your extensive experience as a front-end developer, you are intimately familiar with this process: bundling your code and deploying it to web servers, CDNs, or serverless environments. A deployment diagram is simply a standardized way to visualize that end-state architecture.
Let's begin by dissecting a classic UML deployment diagram.
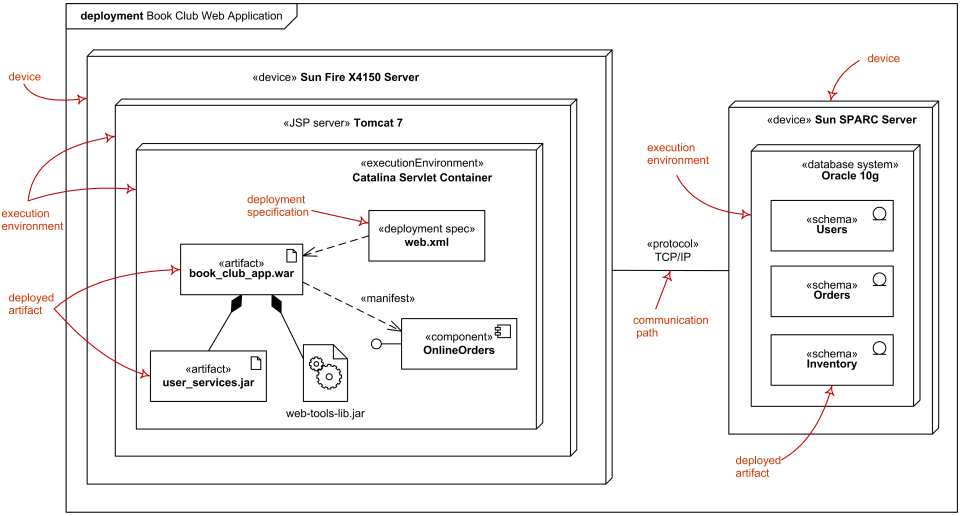
This diagram illustrates the core elements of a deployment view. To get a quick, narrated tour of these concepts, let's watch a few segments from a helpful tutorial video.
This video by Derek Banas provides a concise overview of deployment diagrams. Watch the first four minutes to familiarize yourself with the key visual elements. Pay attention to the distinction between a device (hardware) and an execution environment (software) from the start. Note how communication paths are drawn and labeled to show how nodes connect, as explained from this section. Finally, observe how software artifacts are represented and associated with the nodes they are deployed on, covered between this segment.
The video introduces the key terms and their visual representations. Now, let's formalize those definitions using a more detailed resource and our example image.
UML deployment diagrams overview of graphical notation.
The UML Diagrams website provides comprehensive definitions for each element. As you read, refer back to the "Book Club Web Application" diagram to see the concepts in practice.
First, read the brief introduction to understand the diagram's primary purpose. Next, navigate to the "Node" section. Read the descriptions for a Node and its two specializations: the Device and the Execution Environment. In our example, the Sun Fire and Sun SPARC servers are «device» nodes, while Tomcat 7 and Oracle 10g are «executionEnvironment» nodes nested within them. Then, find the section on Artifacts. In UML, an artifact is a physical piece of information used or produced by a software development process. It's often a deployable file. In the example, book_club_app.war and user_services.jar are artifacts. Read about the Communication Path, which is the line connecting the two servers, stereotyped with the TCP/IP protocol. You can find this in the relevant section. Finally, look at the Deployment relationship itself. This is how we show an artifact lives on a node. The article describes several ways to show this. Read the first paragraph in the "Deployment" section. Notice that our example diagram uses the containment method—placing the artifact symbol inside the node symbol—which is a common and clear approach.
By combining these concepts, we get a complete picture. The book_club_app.war artifact is deployed to the Catalina Servlet Container (an execution environment), which runs on the Tomcat 7 JSP server (another execution environment), which itself is hosted on the Sun Fire X4150 hardware device. This server communicates via TCP/IP with a Sun SPARC Server device, which runs an Oracle 10g database execution environment containing the database schema artifacts.
Crafting Deployment Views with Mermaid
In the previous lesson, we approximated a component diagram using a Mermaid flowchart. For deployment views, Mermaid has introduced a more specialized and powerful tool: the architecture diagram. It's currently in beta but is designed specifically for modeling cloud and system architectures, making it a perfect fit.
Let's use this new diagram type to recreate our book club application example.
Architecture Diagrams Documentation (v11.1.0+) | Mermaid
The official Mermaid documentation explains the syntax for this new diagram type. We'll focus on the core building blocks.
Start by reading the introduction to understand the diagram's intent and basic structure. Review the syntax for defining Groups, which we will use to represent our UML Nodes (both Devices and Execution Environments). Note the use of the in keyword for nesting. Next, look at the syntax for Services. We will use these to represent our UML Artifacts. Notice that services can also be placed in a group. Read the short section on services. Finally, examine the syntax for Edges, which will represent our Communication Paths. Focus on how to connect two elements with a simple line. The section on Edges covers this.
Now, let's put this syntax into practice. We'll map the UML concepts from our example to the Mermaid architecture syntax:
- UML Nodes (
«device»,«executionEnvironment») become Mermaid **group**s. We'll use labels and icons to differentiate them. - UML Artifacts become Mermaid **
service**s. - UML Communication Paths become Mermaid **
edge**s.
Here is the Mermaid code to model the Book Club Web Application:
Let's break down this implementation:
- We use nested
groupblocks to represent the hierarchy of Device -> Execution Environment. - The
(server)and(database)provide icons for quick visual identification. The text in[]provides the full description. - We use
serviceblocks for the.war,.jar, and schema artifacts. - The
edge(--) connects the two systems, with a label indicating the protocol. The connection is drawn from the web application artifact to the database environment it communicates with.
Documenting Notation Gaps
Even with this purpose-built diagram type, we are still creating a practical approximation of formal UML. A complete document should include a legend explaining our conventions and noting what isn't shown.
Diagram Legend:
- This diagram is a UML Deployment View implemented using the Mermaid
architecture-betasyntax.- Nodes are represented by
groupblocks. Icons and labels distinguish between hardware devices (servericon) and software execution environments (databaseicon).- Artifacts are represented by
serviceblocks.- Communication Paths are shown as
edges connecting the groups or services.- The formal UML relationships of «manifest» (linking an artifact to a logical component) and «deployment spec» are not natively supported and are omitted for clarity.
This kind of annotation ensures your diagram is robust and can be correctly interpreted by any team member, regardless of their familiarity with your specific tooling choices.
Conclusion
In this lesson, we've transitioned from logical software components to the physical reality of system deployment. You learned how to visualize the runtime architecture of a system, mapping software artifacts to the infrastructure that hosts them.
Here are the main takeaways:
- A UML deployment diagram models the static physical arrangement of hardware and software, showing which artifacts run on which nodes.
- The core elements are Nodes (physical
Devicesor softwareExecution Environments), deployable Artifacts, and Communication Paths between nodes. - Mermaid's new
architecture-betadiagram type is an excellent tool for this purpose, providing a clear syntax forgroups(nodes),services(artifacts), andedges(paths). - Even with a specialized tool, it is crucial to document your conventions and any notation gaps to ensure your diagram is unambiguous.
This lesson completes our survey of individual UML diagram types. In our final lesson, we will bring everything together. You will assemble a coherent design document for a single system, using a combination of the Mermaid diagrams you've learned to create multiple, consistent views of its architecture, data model, and behavior.
Can't find a good explanation? Sign up and we'll make it for you
Sign up