
Welcome to the course. Psychology offers many compelling explanations for why people think, feel, and behave as they do—but the evidence behind those explanations is not all of the same kind. This first module develops a practical skill you will use throughout the course: reading a research statement closely enough to tell what it actually establishes.
In this lesson, you will distinguish three kinds of claims:
- Descriptive claims tell us what is happening or how common something is.
- Correlational claims tell us whether variables are related.
- Causal claims argue that one variable changes another.
The distinction matters especially in personality psychology. A finding that a trait is associated with a behavior is informative, but it does not show that the trait caused that behavior. We will learn to recognize the difference before evaluating personality tests and theories in later lessons.
Start with the claim, not the topic
A research topic—stress, attachment, coffee, personality, social media—does not determine what a study can conclude. The claim does. Ask first: What is the sentence saying about one or more variables?
A variable is anything that can differ across people, situations, or time: a score on extraversion, hours of sleep, reported anxiety, frequency of exercise, or whether a participant receives a particular intervention.
1. Descriptive claims: “What is this like?”
A descriptive claim reports a level, rate, or characteristic of one variable. It gives a snapshot rather than a relationship or explanation.
Examples:
- “Thirty percent of first-year students report frequent academic stress.”
- “The average conscientiousness score in this sample was moderately high.”
- “Participants spent a median of four hours per day on social media.”
- “A clinician documented the experiences of one patient during recovery.”
These claims may come from surveys, case studies, interviews, or naturalistic observation. Their key question is:
What is occurring in this population or setting?
Descriptive research can be detailed and valuable. For example, observing how often children cooperate on a playground may reveal behavior worth explaining later. But description alone does not establish whether cooperation relates to another variable, nor why it occurs.
A useful language cue is that descriptive claims often involve words such as percentage, average, rate, frequency, number, most, or typical. Still, count variables rather than relying only on keywords. A report can list several separate descriptive facts without claiming that they are related.
For example:
“Seventy percent of respondents exercised this week, and 40 percent reported high stress.”
This contains two descriptive claims, not necessarily a correlational claim. It becomes correlational only if it says something such as, “People who exercised more reported lower stress.”
Read “Three Claims” to build a compact vocabulary for identifying frequency, association, and causal claims in research headlines. It is especially useful because it separates the language of a claim from the design needed to support it.
Begin with the section “Frequency Claims.” Read the opening explanation and the following paragraph on why a single measured variable is the defining feature. Then move to “Association Claims” and read the definition and design. Continue through the subsections “Positive Association,” “Negative Association,” and “Zero Association,” focusing on how the direction of a relationship is expressed. Finally, in “Causal Claims,” read the central contrast, then continue through the table of verbs and the three criteria for causal claims.
Correlational claims: “How are these variables related?”
A correlational claim—also called an association claim—states that two or more variables tend to vary together. The variables are measured, and the researcher assesses their relationship.
Examples:
- “Students who report more sleep tend to report lower daytime fatigue.”
- “Higher trait neuroticism is associated with greater reported stress.”
- “Social support predicts lower loneliness.”
- “Time of dinner is not related to childhood weight in this sample.”
The wording does not say that one variable produces the other. Instead, it says they are related, linked, associated, or correlated.
Reading a scatterplot
A scatterplot represents each participant as one dot. One variable is placed on the horizontal axis and the other on the vertical axis. The overall pattern—not an individual dot—reveals the association.
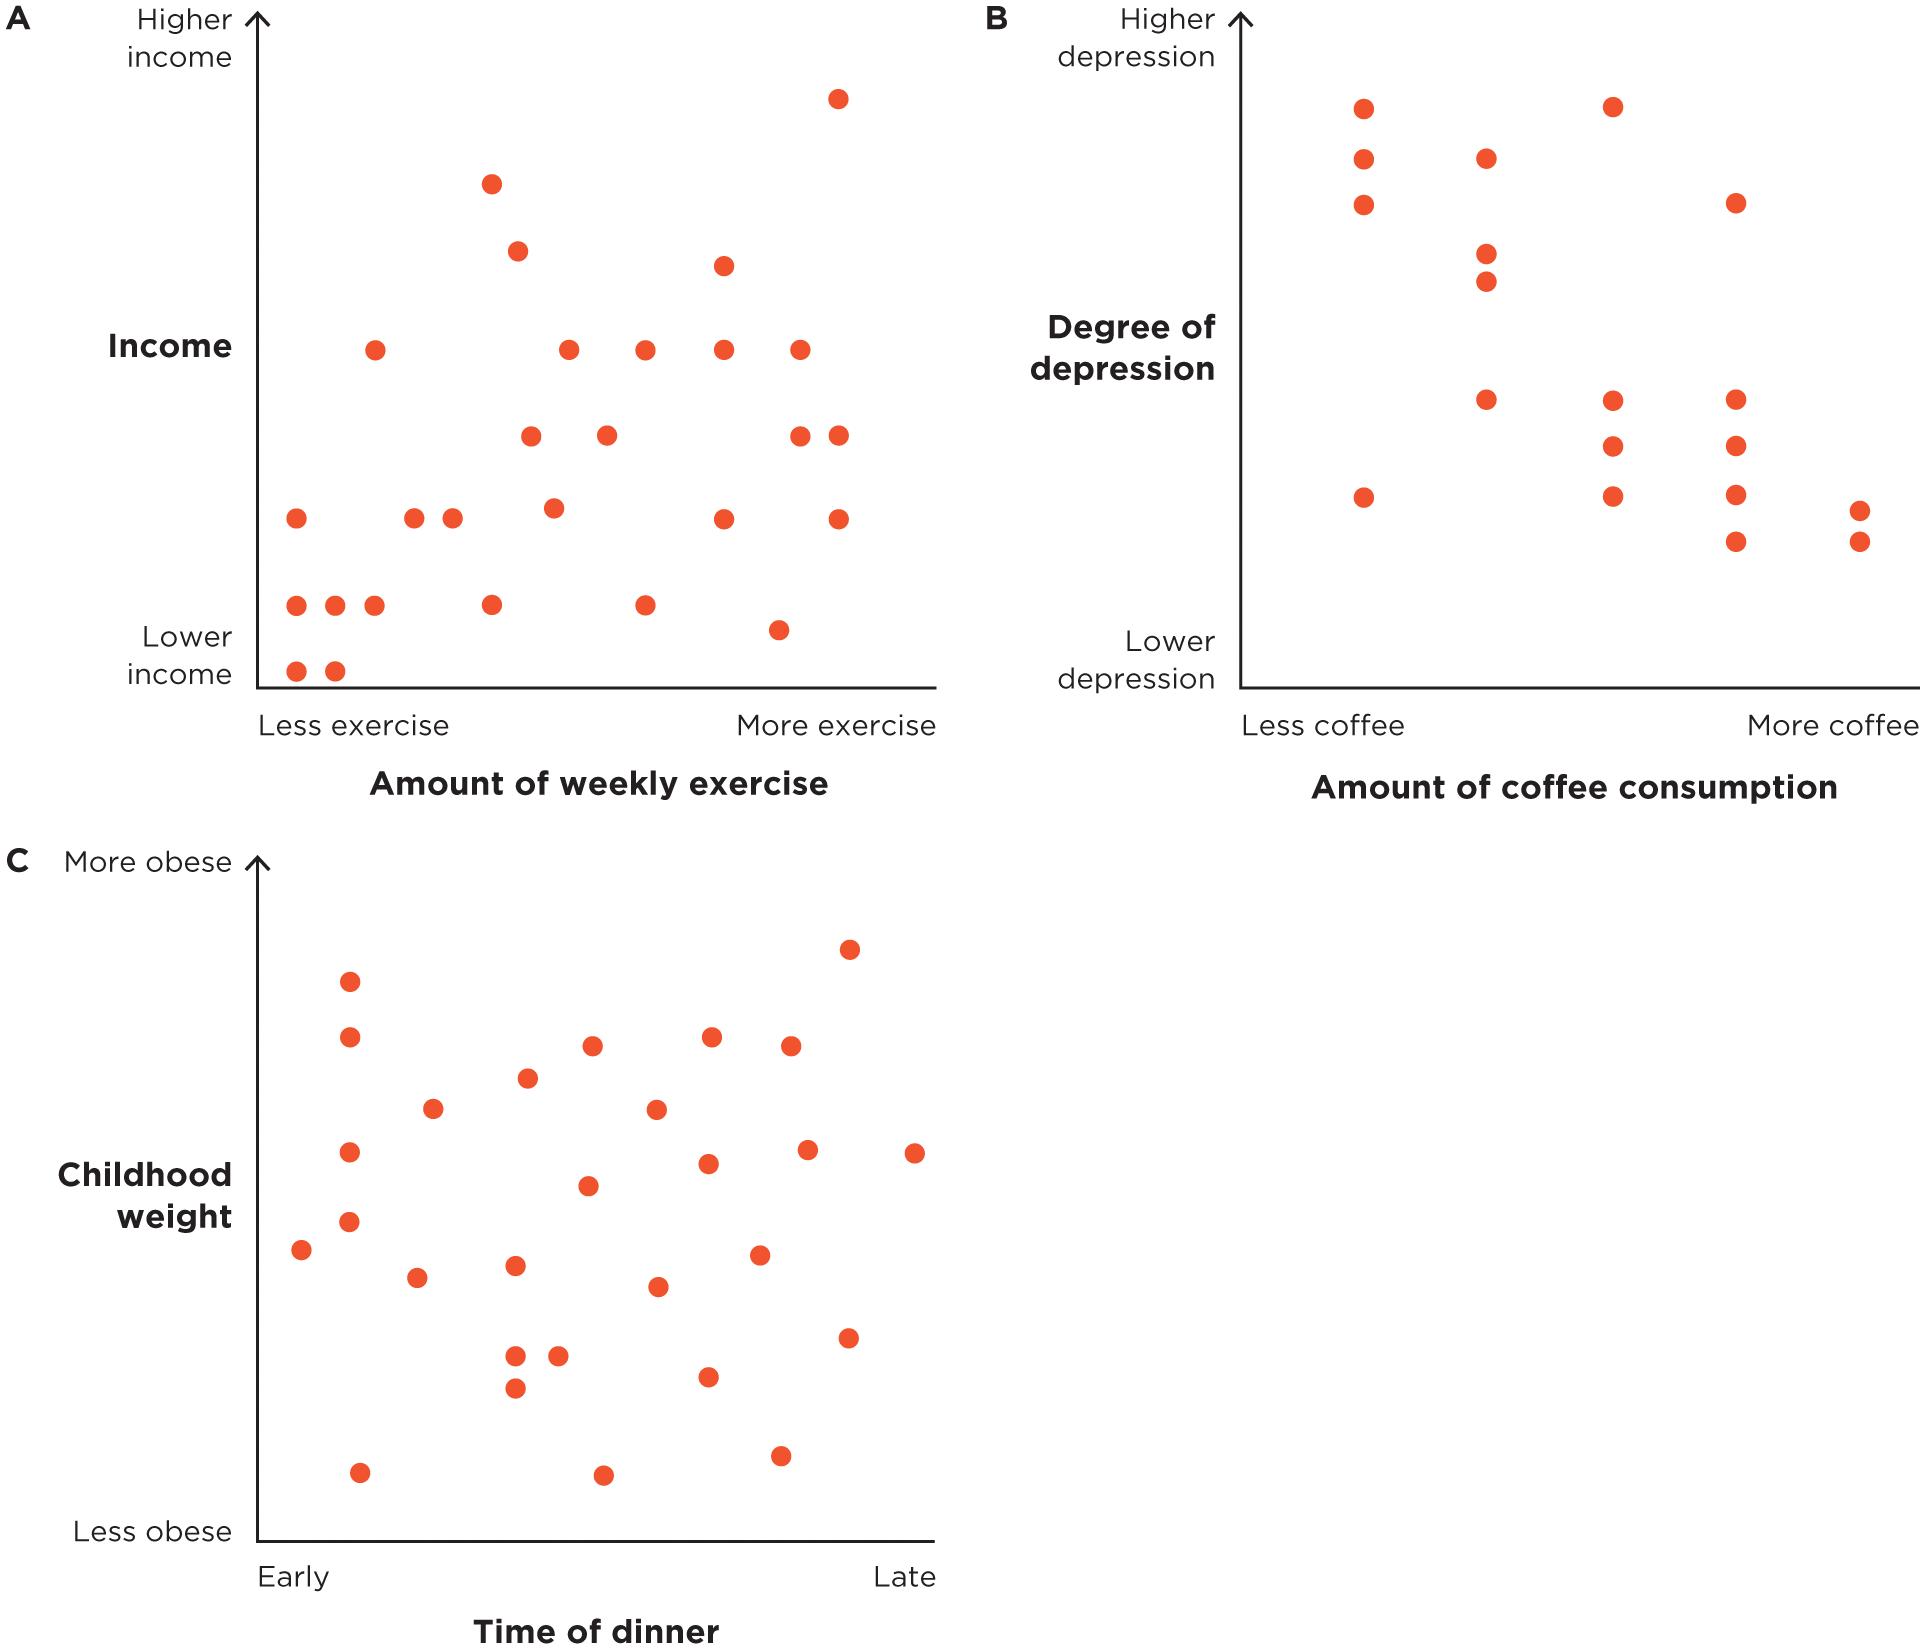
The three basic patterns are:
| Pattern | What it means | Example wording |
|---|---|---|
| Positive association | Higher values of one variable tend to occur with higher values of the other. | “More exercise is associated with higher income.” |
| Negative association | Higher values of one variable tend to occur with lower values of the other. | “More coffee consumption is associated with lower depression.” |
| Zero association | Knowing one variable does not improve prediction of the other. | “Dinner time is not associated with childhood weight.” |
“Positive” and “negative” describe the direction of the pattern, not whether the relationship is desirable or harmful. A negative association between practice and errors, for instance, is usually good news: more practice tends to accompany fewer errors.
Psychologists often summarize the strength and direction of a linear association with a correlation coefficient, , which ranges from to . The sign gives direction, while the distance from zero indicates the strength of the linear relationship. For this lesson, the essential point is conceptual: a correlation helps with prediction, but prediction is not the same as causal explanation.
A relationship can be strong and still be noncausal. If a personality score predicts a workplace outcome, it may be useful for estimating that outcome. It does not follow that changing the score would necessarily change workplace behavior.
Why correlation cannot establish causation
Suppose a study finds that people who sit near the front of a class earn higher course grades. It is tempting to say that sitting near the front improves grades. But a correlational finding leaves several rival explanations open.
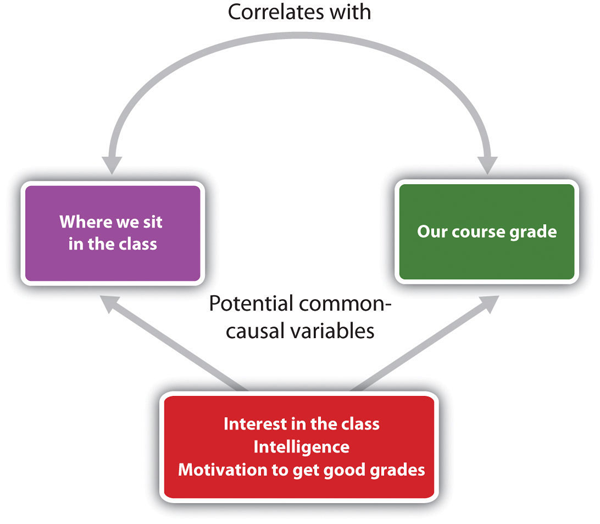
Whenever two measured variables correlate, consider three possibilities:
-
The proposed causal direction may be correct.
Sitting near the front might, in some settings, help attention or participation. -
The direction might be reversed.
Students who are already succeeding might choose front seats because they are more engaged. -
A third variable may influence both.
Interest, prior knowledge, motivation, or confidence could affect both where students sit and how they perform.
The third possibility is called a common-causal variable or third variable. When a common cause creates an apparent relationship between two variables, the observed association can be spurious: the variables correlate, but neither is the cause of the other.
This is not a minor technical caveat. It is a discipline of thought. When encountering a headline such as “Introversion linked to lower social-media use,” treat it as a statement about an observed pattern. Ask what else could explain it: age, occupation, social anxiety, life circumstances, cultural setting, or measurement choices. The correlational result may be meaningful, but it does not settle the mechanism.
Psychological Research: Crash Course Psychology #2
Watch the selected sections of CrashCourse’s “Psychological Research” for a concise visual comparison of descriptive, correlational, and experimental approaches. The segment emphasizes why plausible intuition is not sufficient evidence for a causal conclusion.
First watch descriptive methods, which contrasts case studies, observation, and surveys with explanation. Then watch correlation limits; note the reverse-causation and third-variable alternatives. Finish with experimental logic, focusing on the roles of manipulation, comparison groups, and random assignment.
Causal claims: “Does changing X change Y?”
A causal claim says that one variable is responsible for changing another. Typical causal verbs include:
- causes
- increases or decreases
- improves
- prevents
- affects
- changes
- leads to
- reduces
Compare the meaning of these two statements:
- Association: “Mindfulness practice is associated with lower stress.”
- Causation: “Mindfulness practice reduces stress.”
The second statement is stronger. It says that if people’s mindfulness practice changed, their stress would change as a result. Even tentative phrasing remains causal when it makes this basic claim: “Mindfulness practice may reduce stress” is still a causal claim because reduce identifies an active effect.
For a causal claim to be justified, evidence must satisfy three conditions:
| Requirement | Question to ask |
|---|---|
| Covariation | Do the variables actually differ together? |
| Temporal precedence | Did the proposed cause occur before the outcome? |
| Internal validity | Have reasonable alternative explanations been ruled out? |
A correlational study can often show the first condition. It may sometimes give partial evidence about timing, especially if it follows people across time. But it generally cannot rule out all alternative explanations. For that, psychologists use an experiment.
What makes an experiment capable of supporting causation?
In an experiment, researchers deliberately manipulate an independent variable and measure a dependent variable.
- The independent variable is the condition the researcher changes.
- The dependent variable is the outcome measured after that change.
Imagine researchers ask whether a brief self-affirmation exercise affects persistence on difficult puzzles.
- Independent variable: whether participants complete the self-affirmation exercise or a comparison writing task.
- Dependent variable: how long participants persist on difficult puzzles.
- Causal claim under study: completing the exercise increases persistence.
The central design feature is random assignment. Participants are assigned to conditions by chance, so that before the manipulation, the groups should be similar on average in motivation, prior puzzle ability, personality, sleep, and countless other characteristics. The researcher then compares outcomes after the conditions differ.
This is distinct from random sampling:
- Random sampling concerns who is selected from a population. It helps researchers generalize to that population.
- Random assignment concerns how selected participants are placed into experimental conditions. It helps researchers make causal inferences within the study.
An experiment has limits. It supports a causal conclusion only about the manipulation as actually implemented, the population studied, and the outcome measured. A single laboratory study of a short self-affirmation activity does not automatically establish that all forms of self-affirmation improve persistence in every real-world setting. Replication, measurement quality, ethics, and real-world generalizability remain important.
Still, when a study has a well-designed manipulation, random assignment, appropriate comparison conditions, and a measured outcome, it is in a fundamentally better position to support causal language than a survey that only measured preexisting differences among people.
A fast claim-audit routine
When reading a research article, headline, or personality-test advertisement, use this four-question audit:
-
How many variables are involved?
One variable suggests a descriptive claim. Two or more may suggest an association or causal claim. -
What does the language claim?
Look for descriptive words such as percentage or average; association words such as linked or predicts; and causal words such as improves or reduces. -
Were variables only measured, or was one manipulated?
Measuring existing differences usually supports description or association. Manipulating a variable is necessary for a causal test. -
Was random assignment used, along with a meaningful comparison condition?
If not, be cautious about claims that one variable caused another.
Here is how that works with personality-oriented examples:
| Statement | Claim type | Appropriate conclusion |
|---|---|---|
| “Twenty-five percent of respondents scored high on social anxiety.” | Descriptive | Reports prevalence in the sampled group. |
| “Higher social anxiety scores were associated with fewer reported social outings.” | Correlational | The variables are related; the study does not establish why. |
| “A social-skills training program increased the number of social outings relative to a randomly assigned comparison group.” | Causal | If the experiment was well conducted, it supports a causal conclusion about the program. |
Notice that a causal-sounding headline is not automatically supported by causal evidence. The language of a claim and the design of the study must match. A survey may report that “people who journal have lower anxiety,” but the defensible conclusion remains correlational unless the design can establish causation.
Key takeaways
Descriptive, correlational, and causal claims answer different questions:
- Descriptive claims characterize one variable: what people report, do, or experience.
- Correlational claims assess whether variables are related and can support prediction.
- Causal claims assert that changing one variable produces a change in another and therefore require especially strong evidence.
A correlation does not establish cause because the causal direction may be reversed or because a third variable may explain the relationship. Experiments address these problems by manipulating an independent variable, measuring an outcome, and using random assignment to create comparable groups.
Next, we will apply this evidential framework to a common psychological tool: personality tests. We will examine reliability, asking why a score that changes erratically cannot bear much interpretive weight.
Can't find a good explanation? Sign up and we'll make it for you
Sign up