Hello! Welcome to the first lesson in our module on Unsupervised Learning.
Introduction
In the previous modules, we focused on supervised learning, where models learn from labeled data to make predictions (e.g., classifying images or predicting a value). We culminated this with a deep dive into powerful ensemble methods like XGBoost and LightGBM.
Now, we pivot to a new and exciting domain: unsupervised learning. Here, our algorithms work with data that has no predefined labels. The goal is not to predict an outcome but to discover hidden structures, patterns, and relationships within the data itself.
This lesson introduces one of the most fundamental and widely-used unsupervised algorithms: K-means clustering. We will explore how it works, implement its core logic, and learn how to evaluate its performance without ground-truth labels.
By the end of this lesson, you will be able to:
- Understand the iterative process of the K-means algorithm.
- Implement K-means clustering to partition a dataset.
- Evaluate the quality of the resulting clusters using the silhouette score.
1. What is K-Means Clustering?
Clustering is the task of grouping a set of objects in such a way that objects in the same group (called a cluster) are more similar to each other than to those in other groups. K-means is a centroid-based algorithm that partitions data into a pre-specified number of clusters, k.
The core idea is simple:
- A cluster is represented by its center point, or centroid.
- Each data point is assigned to the cluster whose centroid is nearest.
The algorithm's main objective is to find centroid positions that minimize the Within-Cluster Sum of Squares (WCSS), often called inertia. This metric represents the sum of squared distances between each data point and its assigned cluster's centroid. Minimizing WCSS leads to clusters that are dense and well-separated.
For a concise overview of the goal and properties of K-means, please read the introductory sections of the article "K-Means Clustering Algorithm" from Analytics Vidhya.
Read the sections "What is K-Means Clustering?" and "Properties of K means Clustering". These sections will clarify the algorithm's objective and the two key properties of good clusters: high intra-cluster similarity and low inter-cluster similarity.
2. The K-Means Algorithm: An Iterative Approach
K-means finds the optimal cluster centroids through an iterative process. Since finding the absolute best solution (the global minimum of WCSS) is computationally very difficult (NP-hard), K-means uses an algorithm that is guaranteed to find a good solution (a local minimum).
The algorithm consists of four main steps:
- Initialization: Choose the number of clusters,
k, and randomly initializekdata points as the initial centroids. - Assignment Step: For each data point, calculate its distance (typically Euclidean distance) to every centroid. Assign the data point to the cluster of the closest centroid.
- Update Step: After assigning all data points, recalculate the centroid of each cluster by taking the arithmetic mean of all points assigned to it.
- Convergence: Repeat the Assignment and Update steps until the centroids no longer move significantly or the cluster assignments stabilize.
K-means Clustering: Complete Guide with Algorithm, Implementation & Best Practices
The article "K-means Clustering: Complete Guide..." provides a formal breakdown of this iterative process. Pay close attention to the mathematical definitions of each step.
Read the subsection "The K-means Algorithm: An Iterative Solution". This details the initialization, assignment, update, and convergence steps with their corresponding mathematical formulations.
3. Implementing K-Means From Scratch
Given your background in programming, walking through a from-scratch implementation is the best way to solidify your understanding of the algorithm's mechanics. We will use a video tutorial as our guide.
K-means Clustering From Scratch In Python [Machine Learning Tutorial]
This video from Dataquest provides an excellent, step-by-step walkthrough of building K-means in Python. It covers data preparation, centroid initialization, and the main iterative loop.
Watch the following segments to understand each part of the implementation: Algorithm Overview (00:00 - 02:43): A recap of the iterative steps. Data Preparation & Scaling (02:43 - 10:22): Note the importance of scaling features to a common range (e.g., 1-10) so that no single feature dominates the distance calculations. Initializing Centroids (10:22 - 14:17): See how to randomly select initial centroid positions. Assigning Labels (14:17 - 19:28): Understand how to compute the Euclidean distance and assign each point to the closest centroid. Updating Centroids (19:28 - 23:23): This part demonstrates how to recalculate the centroids. Important Note: The video implements the update using the geometric mean. The standard K-means algorithm, which aims to minimize the sum of squared Euclidean distances, uses the arithmetic mean for this step. The arithmetic mean is the point that uniquely minimizes this sum for a given cluster. We will stick to the standard definition using the arithmetic mean. The Main Loop (28:24 - 32:32): See how all the functions are combined into a loop that runs until the centroids converge.
The from-scratch implementation reveals the simplicity and elegance of the K-means algorithm. The key is the two-step dance: assign points, then update centers, repeated until stability.
4. Evaluating Cluster Performance: The Silhouette Score
A crucial question in clustering is: "How good are my clusters?". Since we don't have true labels, we need an intrinsic metric that measures cluster quality. The Silhouette Score is one of the most effective.
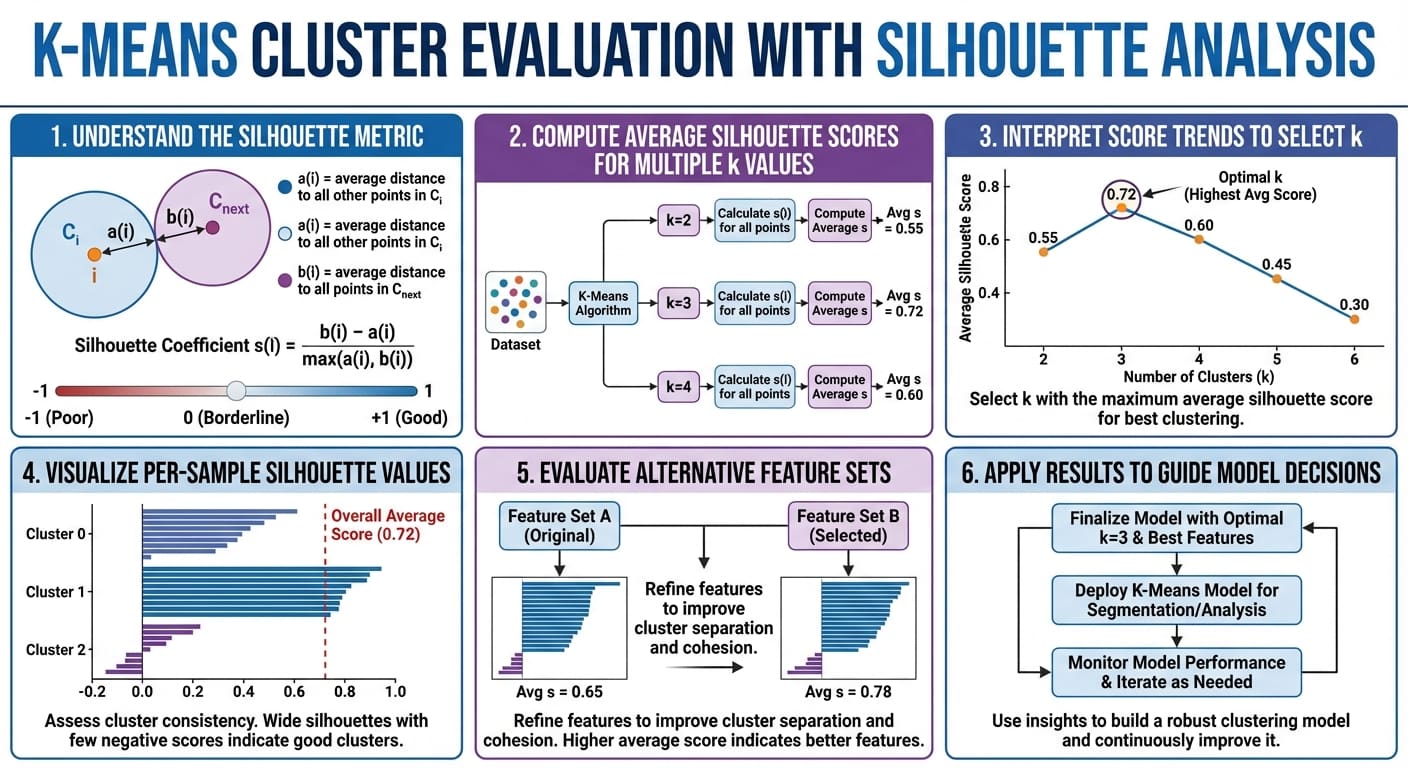
The silhouette score for a single data point measures how well it fits into its assigned cluster versus how well it would fit into the next-best (nearest) cluster. It is calculated as:
Where:
- is the mean intra-cluster distance: the average distance from point to all other points within the same cluster. This measures cluster cohesion. A small value is good.
- is the mean nearest-cluster distance: the average distance from point to all points in the nearest neighboring cluster. This measures cluster separation. A large value is good.
The score ranges from -1 to +1:
- +1: The point is far from the neighboring cluster and very close to its own. (Excellent clustering)
- 0: The point is on or very close to the decision boundary between two clusters.
- -1: The point is closer to a neighboring cluster than to its own. (Poor clustering; likely misclassified)
By averaging the silhouette score over all points, we get a single number that reflects the overall quality of our clustering for a given k.
Silhouette (clustering)- Validating Clustering Models- Unsupervised Machine Learning
Let's watch a video by Krish Naik that explains the intuition and mathematics behind the silhouette score.
Watch the following parts: Calculating a(i) (04:06 - 06:32): This explains the intra-cluster distance calculation. Calculating b(i) (06:32 - 08:27): This explains the nearest-cluster distance calculation. The Silhouette Formula and Interpretation (08:27 - 11:21): This brings it all together, explaining the formula and how to interpret the resulting score.
The average silhouette score is also a powerful tool for choosing the optimal number of clusters, k. We can calculate the score for a range of k values and select the k that yields the highest score.
5. Practical Implementation with Scikit-Learn
While building K-means from scratch is insightful, in practice, you'll use optimized library implementations like scikit-learn. Let's see how to implement K-means and use the silhouette score in just a few lines of code.
K-means Clustering: Complete Guide with Algorithm, Implementation & Best Practices
The "K-means Clustering: Complete Guide..." article provides a clear, practical example of using scikit-learn for K-means.
Read through the following sections of the "Python Implementation with Scikit-learn" part of the article: "Step 2: Basic K-means Implementation": See how to initialize and fit the KMeans model. "Step 3: Clustering Quality Evaluation": Observe the use of silhouette_score from sklearn.metrics. "Step 4: Finding the Optimal Number of Clusters": This shows the standard workflow of looping through a range of k values, fitting a model for each, and storing the silhouette scores to find the maximum.
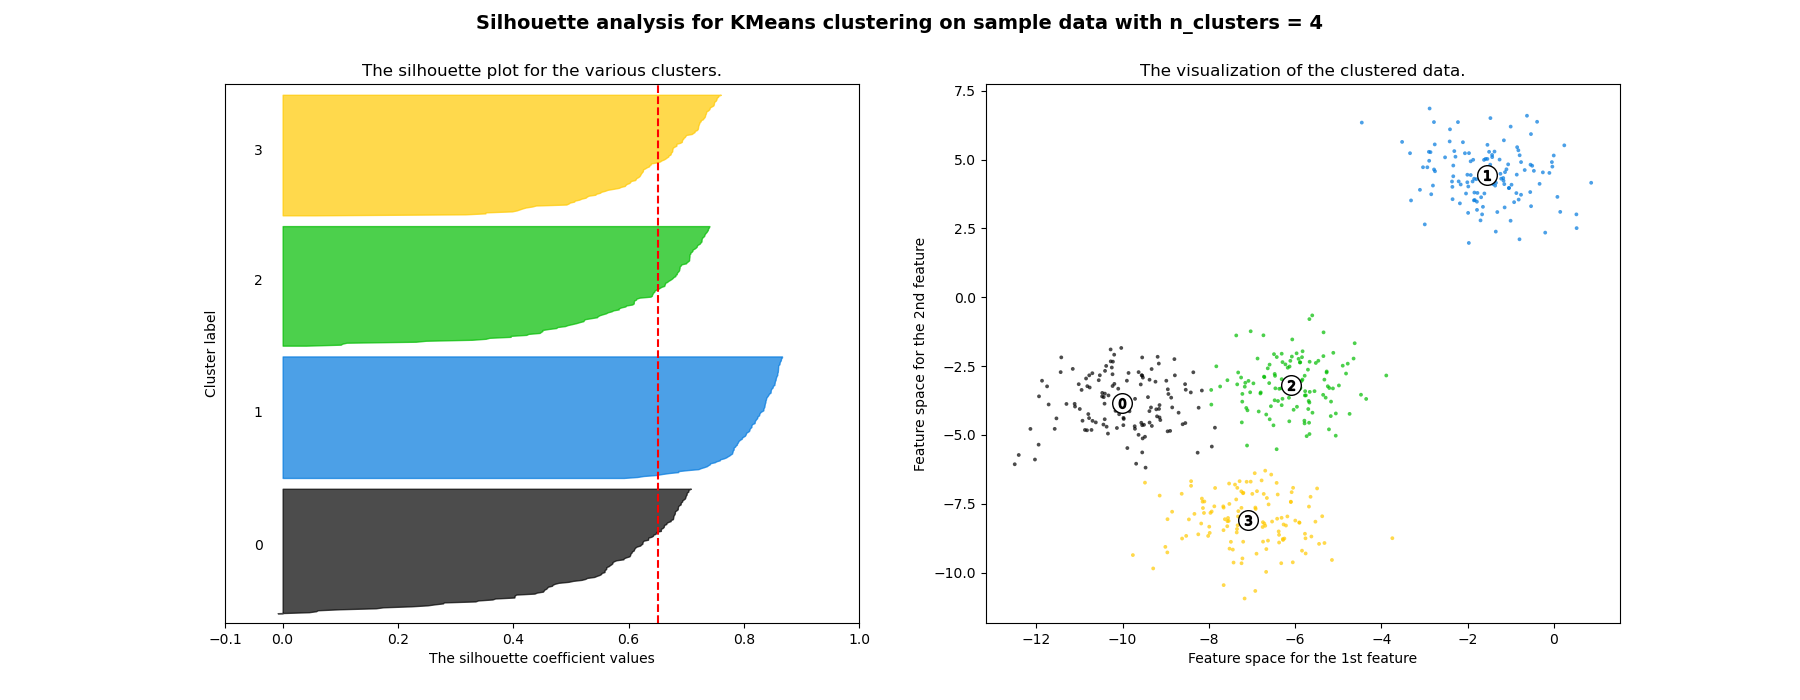
Visualizing the silhouette scores for each point can also provide deeper insights.
Test your understanding!
You run K-means for k=4 and get an average silhouette score of 0.75. You then run it for k=5 and get a score of 0.60. Which k is likely better, and why? Furthermore, upon inspecting the silhouette plot for k=5, you notice that one of the five clusters has most of its points with negative silhouette scores. What does this suggest about that specific cluster?
Show answer
-
Optimal k:
k=4is the better choice. It has a significantly higher average silhouette score (0.75 vs. 0.60), indicating that the clusters are, on average, more dense and better separated. -
Interpretation of the negative scores: A cluster with mostly negative silhouette scores suggests that its points are, on average, closer to the centroid of a neighboring cluster than to their own. This means the cluster is not well-formed and its points have likely been mis-assigned. It's a strong indicator that
k=5is forcing an artificial separation where one does not naturally exist in the data.
Conclusion
In this lesson, we took our first step into the world of unsupervised learning by dissecting the K-means algorithm. You now understand its goal of minimizing within-cluster variance and its simple yet powerful iterative process of assignment and updating.
Key Takeaways:
- K-means is an unsupervised algorithm that partitions data into
kclusters by minimizing the distance between data points and their cluster's centroid (WCSS/Inertia). - The algorithm iterates between two steps: assigning points to the nearest centroid and updating centroids to be the mean of their assigned points.
- Feature scaling is crucial before applying K-means to ensure all features contribute equally to the distance calculations.
- The Silhouette Score is an effective metric for evaluating clustering performance without true labels, measuring both cluster cohesion and separation.
- The average silhouette score can be used to help determine the optimal number of clusters,
k.
Preview of the next lesson:
While K-means is powerful, it requires us to specify the number of clusters k in advance. What if we don't know the best k or want to explore the data's hierarchical structure? In our next lesson, we will explore hierarchical clustering, a method that builds a tree-like structure of nested clusters, providing a much richer view of the relationships within our data.