
Hello again. In the previous lesson, you treated job postings as market evidence and identified a recurring requirement for analytics leaders: connect technical work to a concrete business outcome. This lesson turns that requirement into a practical framing skill.
Senior stakeholders rarely arrive with an analytics-ready request. They say things such as “reduce churn,” “improve patient experience,” “make operations more efficient,” or “use AI in customer service.” Those are useful strategic intentions, but they do not yet tell a team what to build, what data to use, or how anyone will act differently.
By the end of this lesson, you will be able to translate such an objective into a concise analytics problem statement that specifies:
- the decision that will change;
- the user who makes it;
- the target or analytical output needed;
- the unit of analysis;
- the time horizon, including when action occurs and when the outcome is observed.
This is deliberately pre-modeling work. A well-framed problem may ultimately call for SQL reporting, a forecast, a prioritization rule, an experiment, or machine learning. “Use ML” is not itself a problem definition.
Start with the decision, not the dashboard or model
Consider the objective:
“Reduce missed outpatient appointments.”
It sounds clear until a team begins work. Does “reduce” mean fewer no-shows, fewer late cancellations, or more appointments successfully rebooked? Is the desired action an additional reminder, a phone call, transport support, a scheduling-policy change, or overbooking? Who has authority to make that action happen? And how far in advance must the team know?
Without answers, a team can produce a technically respectable model that has no operational role.
The key reframing question is:
When an analytical output is available, what specific decision changes, who makes it, and what do they do differently?
A prediction is not a decision. “Predict churn” describes a potential output. “Each Monday, the retention manager chooses which 200 customers receive a personal outreach offer” describes a decision.
That distinction matters in leadership roles because it prevents an expensive but familiar failure mode: the team optimizes a model metric while the business has no capacity, process, or incentive to use its output.
Stop Tuning Hyperparameters. Start Tuning Your Problem.
Read this problem-framing guide from Towards Data Science for a practical decision-first protocol. Its strongest contribution here is the insistence that a model must change a real operational choice, and that the target must be available early enough for that choice.
In “The 5-Step Problem Framing Protocol,” focus first on Step 1, “Name the Decision (Not the Prediction).” Read the framing question and example; notice how the example names an actor, a capacity constraint, an action, and a cadence. Then, in Step 3, “Audit the Target Variable,” read the first two target checks. Focus on the difference between a convenient database field and an outcome that is meaningful and actionable.
A useful rule of thumb is:
If nobody can say what they would do differently after seeing the output, you have a topic for exploration, not yet a decision-centered analytics use case.
Exploration can still be valuable. For example, a descriptive analysis might reveal why appointment attendance differs by clinic, day, lead time, or patient pathway. But its immediate decision may be “which process hypothesis should we test?” rather than “which individual should receive an intervention?”
The five fields of a decision-centered analytics problem
The following five fields force strategic language into an implementable analytical specification.
| Field | The question to answer | Weak formulation | Decision-centered formulation |
|---|---|---|---|
| Decision | What action changes because of the analysis? | “Predict no-shows.” | “Prioritize limited outreach slots for upcoming appointments.” |
| User | Who sees the output and has authority to act? | “The business.” | “The central scheduling operations team.” |
| Target | What quantity, event, category, or ranking must be estimated? | “Risk.” | “Probability that a booked appointment will become a no-show.” |
| Unit of analysis | What does one row or prediction represent? | “A patient.” | “One scheduled appointment.” |
| Time horizon | When is the prediction made, when is action taken, and when is the target observed? | “Predict future no-shows.” | “Refresh daily for appointments occurring 3–10 days ahead; observe attendance after the appointment time.” |
The fields are connected. If any one is vague, the others are likely to drift.
1. Decision: state the action in a verb
A decision must include an action, not merely an intention. Good decision verbs include:
- prioritize;
- approve;
- route;
- schedule;
- intervene;
- allocate;
- investigate;
- recommend;
- contact;
- hold inventory;
- adjust capacity.
For a commercial example, “increase customer retention” is an outcome goal. A decision could be:
Each week, the CRM manager allocates the limited personal-outreach budget across eligible customers.
For an operations example, “reduce delivery delays” is an outcome goal. A decision could be:
Each morning, the regional dispatcher prioritizes which shipments receive proactive intervention.
The decision should also expose constraints. A retention team that can make 200 calls per week needs a ranked list, not a generic statement that “some customers are at risk.” Constraints make analytical design more realistic.
2. User: identify the accountable decision-maker
“The business” is too broad. A decision user should be a role, team, or system with both access to the output and authority to act.
Distinguish three roles that are often blurred:
| Role | Example | Why it matters |
|---|---|---|
| Decision user | Scheduling operations lead | Needs output in an actionable format. |
| Economic owner | Outpatient services director | Owns the value case and can resolve trade-offs. |
| Technical owner | Analytics or data science lead | Owns validity, reproducibility, and implementation quality. |
A dashboard may have hundreds of viewers but only one or two true decision users. In discovery conversations, ask: “Whose workflow changes on Tuesday morning if this is successful?”
This question is particularly useful in consulting-style engagements, where executive sponsors may commission the work but frontline managers must use it.
3. Target: define what the analysis estimates
The target is the outcome, class, number, or score the analytical work needs to estimate or measure. It is not necessarily the same as the strategic objective.
For example:
| Strategic objective | Possible target | Important caution |
|---|---|---|
| Improve retention | Probability of cancellation in the next 30 days | Cancellation may not fully represent disengagement. |
| Reduce no-shows | Whether an appointment is not attended and not cancelled at least 24 hours ahead | Define treatment of late cancellations explicitly. |
| Improve staffing | Number of incoming service requests in each shift | The target is a count, not “staffing need” itself. |
| Reduce fraud loss | Probability that a transaction is unauthorized | A score supports review; it does not itself prove fraud. |
| Improve customer support | Intent category of an incoming ticket | The target supports routing, not necessarily resolution quality. |
A target should be observable, operationally meaningful, and available at a time consistent with the decision.
This is where teams often confuse a convenient data field with the phenomenon that matters. For instance, a subscription cancellation event is easy to record, but a stakeholder may really care about customers who have stopped engaging long before they formally cancel. The appropriate target depends on the action the business can take.
Google’s Machine Learning problem-framing material distinguishes the ideal business outcome from the narrower goal assigned to a model. It also highlights a crucial idea: when the ideal outcome cannot be directly measured, a team may need a proxy label. A proxy can be useful, but it must be treated as an imperfect substitute rather than the truth.
Framing an ML problem | Machine Learning
Read Google’s Machine Learning problem-framing guide to connect a broad product or business outcome to the output that an analytical system can actually produce. The regression-versus-classification discussion is useful because the output should fit the decision rule, not just the available data type.
In “Define the ideal outcome and the model's goal,” read the outcome-to-goal examples. Notice that each model goal makes the output specific. Next, in “Identify the output you need,” read the output-selection introduction, then continue through the classification and regression examples. In the regression discussion, focus on the point that product thresholds can make two numerically similar predictions operationally very different. Finally, in “Proxy labels,” read from the example beginning the proxy-label discussion. Track why clicks, likes, or watch time may distort the intended outcome.
A practical target definition should answer:
- What exactly counts as a positive event or outcome?
- What events are excluded?
- Where is it recorded?
- When does it become known?
- Does it reflect the outcome the user is trying to influence?
You do not need the final data schema at this stage. You do need language precise enough that a domain expert, analyst, and engineer would count outcomes the same way.
4. Unit of analysis: define one prediction or record
The unit of analysis is the entity represented by one analytical observation or prediction. It determines the dataset’s grain.
Common units include:
- one customer;
- one customer-week;
- one appointment;
- one transaction;
- one shipment;
- one store-product-day;
- one support ticket;
- one machine-hour.
This matters because a business noun can conceal multiple possible units. “Customer churn” might be modeled per customer, per account, per customer-month, or per contract. “Demand forecasting” might mean store-week, product-store-day, or regional-month.
For missed appointments, using patient as the unit loses useful variation: one person may attend some appointments and miss others. Using appointment as the unit supports an appointment-specific decision such as whether to offer a reminder or fill a likely vacancy.
A simple test is to complete this sentence:
“For each ___, the analysis will produce one score, prediction, or recommendation.”
If there are several plausible answers, choose the one that matches the decision action.
5. Time horizon: make time operational
Time horizon is more than “next month.” A robust definition includes three separate timings:
- As-of time: when the system knows what it knows and generates an output.
- Action window: how much time the user has to act.
- Outcome window: when the target is observed.
For an appointment-intervention use case:
| Temporal element | Specification |
|---|---|
| As-of time | Refresh scores at 08:00 each day. |
| Action window | Outreach team acts before the appointment. |
| Scoring population | Appointments scheduled 3–10 calendar days ahead. |
| Outcome window | Attendance status is final after the scheduled appointment time. |
The 3-day minimum is not a technical detail; it is part of the business logic. If an intervention needs two days to be scheduled and delivered, a score generated the evening before the appointment may be accurate but useless.
Time horizons also protect against a common analytical error: using information that was only recorded after the decision point. Later in the course, this becomes the formal issue of data leakage. For now, the framing discipline is simple: would the decision user genuinely have known this information when making the decision?
Worked example: from “reduce no-shows” to a usable specification
Let us turn the initial objective into a first-pass problem statement.
Ambiguous objective
Reduce missed outpatient appointments and improve clinical capacity.
This statement combines at least two desired outcomes: patient attendance and better use of clinician time. It says nothing about the operational lever.
Discovery questions
A data lead should ask questions like these in a stakeholder workshop:
- Which appointments create the greatest avoidable capacity loss?
- What interventions are available: automated reminder, personal call, waitlist replacement, transport support, or rescheduling?
- Which team controls those interventions?
- What capacity limits exist?
- How far in advance must the team act?
- Does a late cancellation create the same operational problem as a no-show?
- Are all appointment types suitable for the same intervention?
Suppose the answers reveal that a scheduling team has capacity for 200 personal outreach calls per day, has reliable attendance data, and can act effectively only when an appointment is at least three days away.
Framed analytics problem
Each weekday morning, the central scheduling operations team will use a ranked list to allocate up to 200 personal outreach calls to appointments scheduled 3–10 days ahead. For each scheduled outpatient appointment, estimate the probability that the patient will not attend and will not cancel at least 24 hours before the appointment, using only information available at the time of scoring. The outcome is observed after the scheduled appointment time.
Now the five fields are explicit:
| Field | Specification |
|---|---|
| Decision | Allocate 200 personal outreach calls. |
| User | Central scheduling operations team. |
| Target | Probability of no attendance without cancellation at least 24 hours before the appointment. |
| Unit | One scheduled outpatient appointment. |
| Time horizon | Score each weekday; appointments are 3–10 days away; observe outcome after appointment time. |
Notice what this formulation does not yet claim:
- It does not assume that machine learning is required.
- It does not claim that outreach causes attendance to improve.
- It does not choose a model, metric, feature set, or threshold.
- It does not assume the intervention is appropriate for every patient group.
Those are important later questions. But the problem is now sufficiently clear to assess data availability, design a baseline, define success measures, and decide whether prediction is the right approach.
Match the output to the decision
A target need not always produce a simple yes-or-no classification. The output should serve the decision.
| Decision need | Useful analytical output | Example |
|---|---|---|
| Allocate a scarce intervention | Ranked risk or value score | Rank appointments by likelihood of a costly no-show. |
| Plan resources | Numerical forecast | Predict daily inbound support tickets by queue. |
| Route work | Category | Classify a support ticket into billing, technical, or account access. |
| Investigate anomalies | Alert or prioritized exception list | Identify transactions that deserve manual review. |
| Understand current performance | Descriptive metric and segmentation | Compare appointment attendance by clinic and lead time. |
Sometimes a continuous numerical prediction is mapped into discrete actions. For example, a forecast of demand may put a location into low-, medium-, or high-staffing bands.
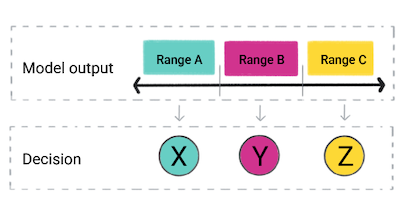
The image makes a subtle point: models do not know the business meaning of their scores by themselves. A predicted value becomes valuable only when a person or system has a defined action for that range.
The Berkeley case study offers a useful example of narrowing an initially broad customer objective. Watch how the speakers move from “serve users better” toward a daily estimate of customer lifetime value after sign-up, while deliberately choosing a data source with sufficient quality rather than automatically integrating every available data stream.
Using Machine Learning and Data Science to Solve Real Business Problems (DataEDGE 2018)
Watch “Using Machine Learning and Data Science to Solve Real Business Problems” from the Berkeley School of Information. This short case shows how a business workshop can uncover the actual operational bottleneck and turn it into a time-specific prediction task.
Watch the customer case. Identify the original business ambition, the decision-relevant obstacle, the target being estimated, the unit being scored, and the daily timing of the prediction. Also note why the team restricted the first solution to transactional data.
A reusable problem-framing template
For your own projects, use this two-sentence structure before opening a notebook or requesting a data extract:
Decision statement: At each [cadence], [user role] will [action] for [set of units], subject to [capacity or policy constraint], to improve [business outcome].
Analytics statement: For each [unit of analysis], at [as-of time], estimate or measure [precisely defined target] over [outcome window], using only information available by the as-of time, so the user can make the stated decision.
Here are two examples outside healthcare.
Example: subscription business
Ambiguous objective: “Improve retention among valuable customers.”
Decision statement: Each Monday, the customer-success manager will assign 50 account-manager outreach slots to active business accounts that are eligible for retention support.
Analytics statement: For each active account, estimate the probability of cancelling a paid subscription within the next 60 days, using account activity and support history available at the weekly scoring date.
The unit is account, not individual user. The target is cancellation within 60 days, not the vague notion of “being unhappy.” The decision capacity is visible.
Example: logistics operations
Ambiguous objective: “Reduce late deliveries.”
Decision statement: Each morning, a regional dispatch lead will prioritize up to 30 same-day shipments for proactive carrier escalation.
Analytics statement: For each shipment scheduled for delivery that day, estimate whether it will miss its promised delivery window, using status events and route information available by 07:00.
The unit is shipment, not customer or route. The time horizon is same-day, which has implications for data freshness and operational feasibility.
Common framing failures
Before treating a specification as ready, check for these patterns.
| Failure | Why it fails | Repair |
|---|---|---|
| “Build a churn model.” | No action, user, or timing is stated. | Name the retention decision and the team making it. |
| “Predict high-value customers.” | “High value” is undefined. | Define the value measure and the period, such as 12-month gross margin. |
| “Use AI to automate support.” | The operating task is unclear. | Specify whether the system routes tickets, drafts replies, summarizes cases, or predicts escalation. |
| “Analyze patient behavior.” | No unit, target, or decision exists. | Identify a clinical or operational decision that analysis could inform. |
| “Forecast demand.” | The required grain and horizon are missing. | Define, for example, product-store-day demand for the next 14 days. |
| “Predict no-shows the day before.” | It may leave no time to act. | Align the scoring window with the intervention lead time. |
| “Optimize customer happiness.” | The target is likely an imperfect proxy. | Select a measurable proxy and document what it misses. |
The strongest framing test is a short operational simulation. Pick a hypothetical output and ask:
- What does the user do with it?
- Can they act in time?
- Do they have capacity to act?
- What happens for units that are not selected?
- Which stakeholders would challenge the target definition?
If the answers are unclear, return to the decision statement rather than trying to solve the uncertainty with a more sophisticated algorithm.
Key takeaways
An ambiguous objective becomes an analytics problem only when it describes a real decision context.
- Begin with the decision that changes, not a desired model or dashboard.
- Name a specific user with authority and a workflow in which the output will be used.
- Define the target precisely, including what counts and what does not.
- Choose a unit of analysis that matches the action: account, appointment, shipment, ticket, or another clear grain.
- Specify the time horizon through the as-of time, action window, and outcome window.
- Treat proxy labels carefully: convenient measures can differ from the business outcome you intend to improve.
Save one completed two-sentence framing template for a plausible portfolio project or a past project from your experience. It will become a useful input to your job-search narrative as well as to the next lesson.
Next, you will construct a metric tree that connects this kind of analytical output to operational measures and financial outcomes. That will let you explain not merely what a model predicts, but why the resulting decision should create value.
Can't find a good explanation? Sign up and we'll make it for you
Sign up