
Hello again. In the last lesson, you turned broad concerns about data availability, latency, privacy, fairness, and operational capacity into explicit design constraints. Those constraints tell you what a responsible solution may do. This lesson adds the next discipline: deciding how you will know whether it is actually good enough to proceed.
For an analytics initiative, “the model looks promising” is not a decision standard. You need a credible description of the current state, a comparison point, and pre-agreed criteria for technical quality, operational delivery, business value, and unacceptable side effects. By the end of this lesson, you should be able to define a simple baseline and write measurable acceptance criteria that a sponsor, analyst, engineer, and operational team can all evaluate.
A baseline is a reference point, not a target
A baseline is the measurable state of performance before a change, or the performance of a credible existing alternative. A target is the future level you intend to reach. These are easy to confuse, particularly when a dashboard shows both as horizontal lines.
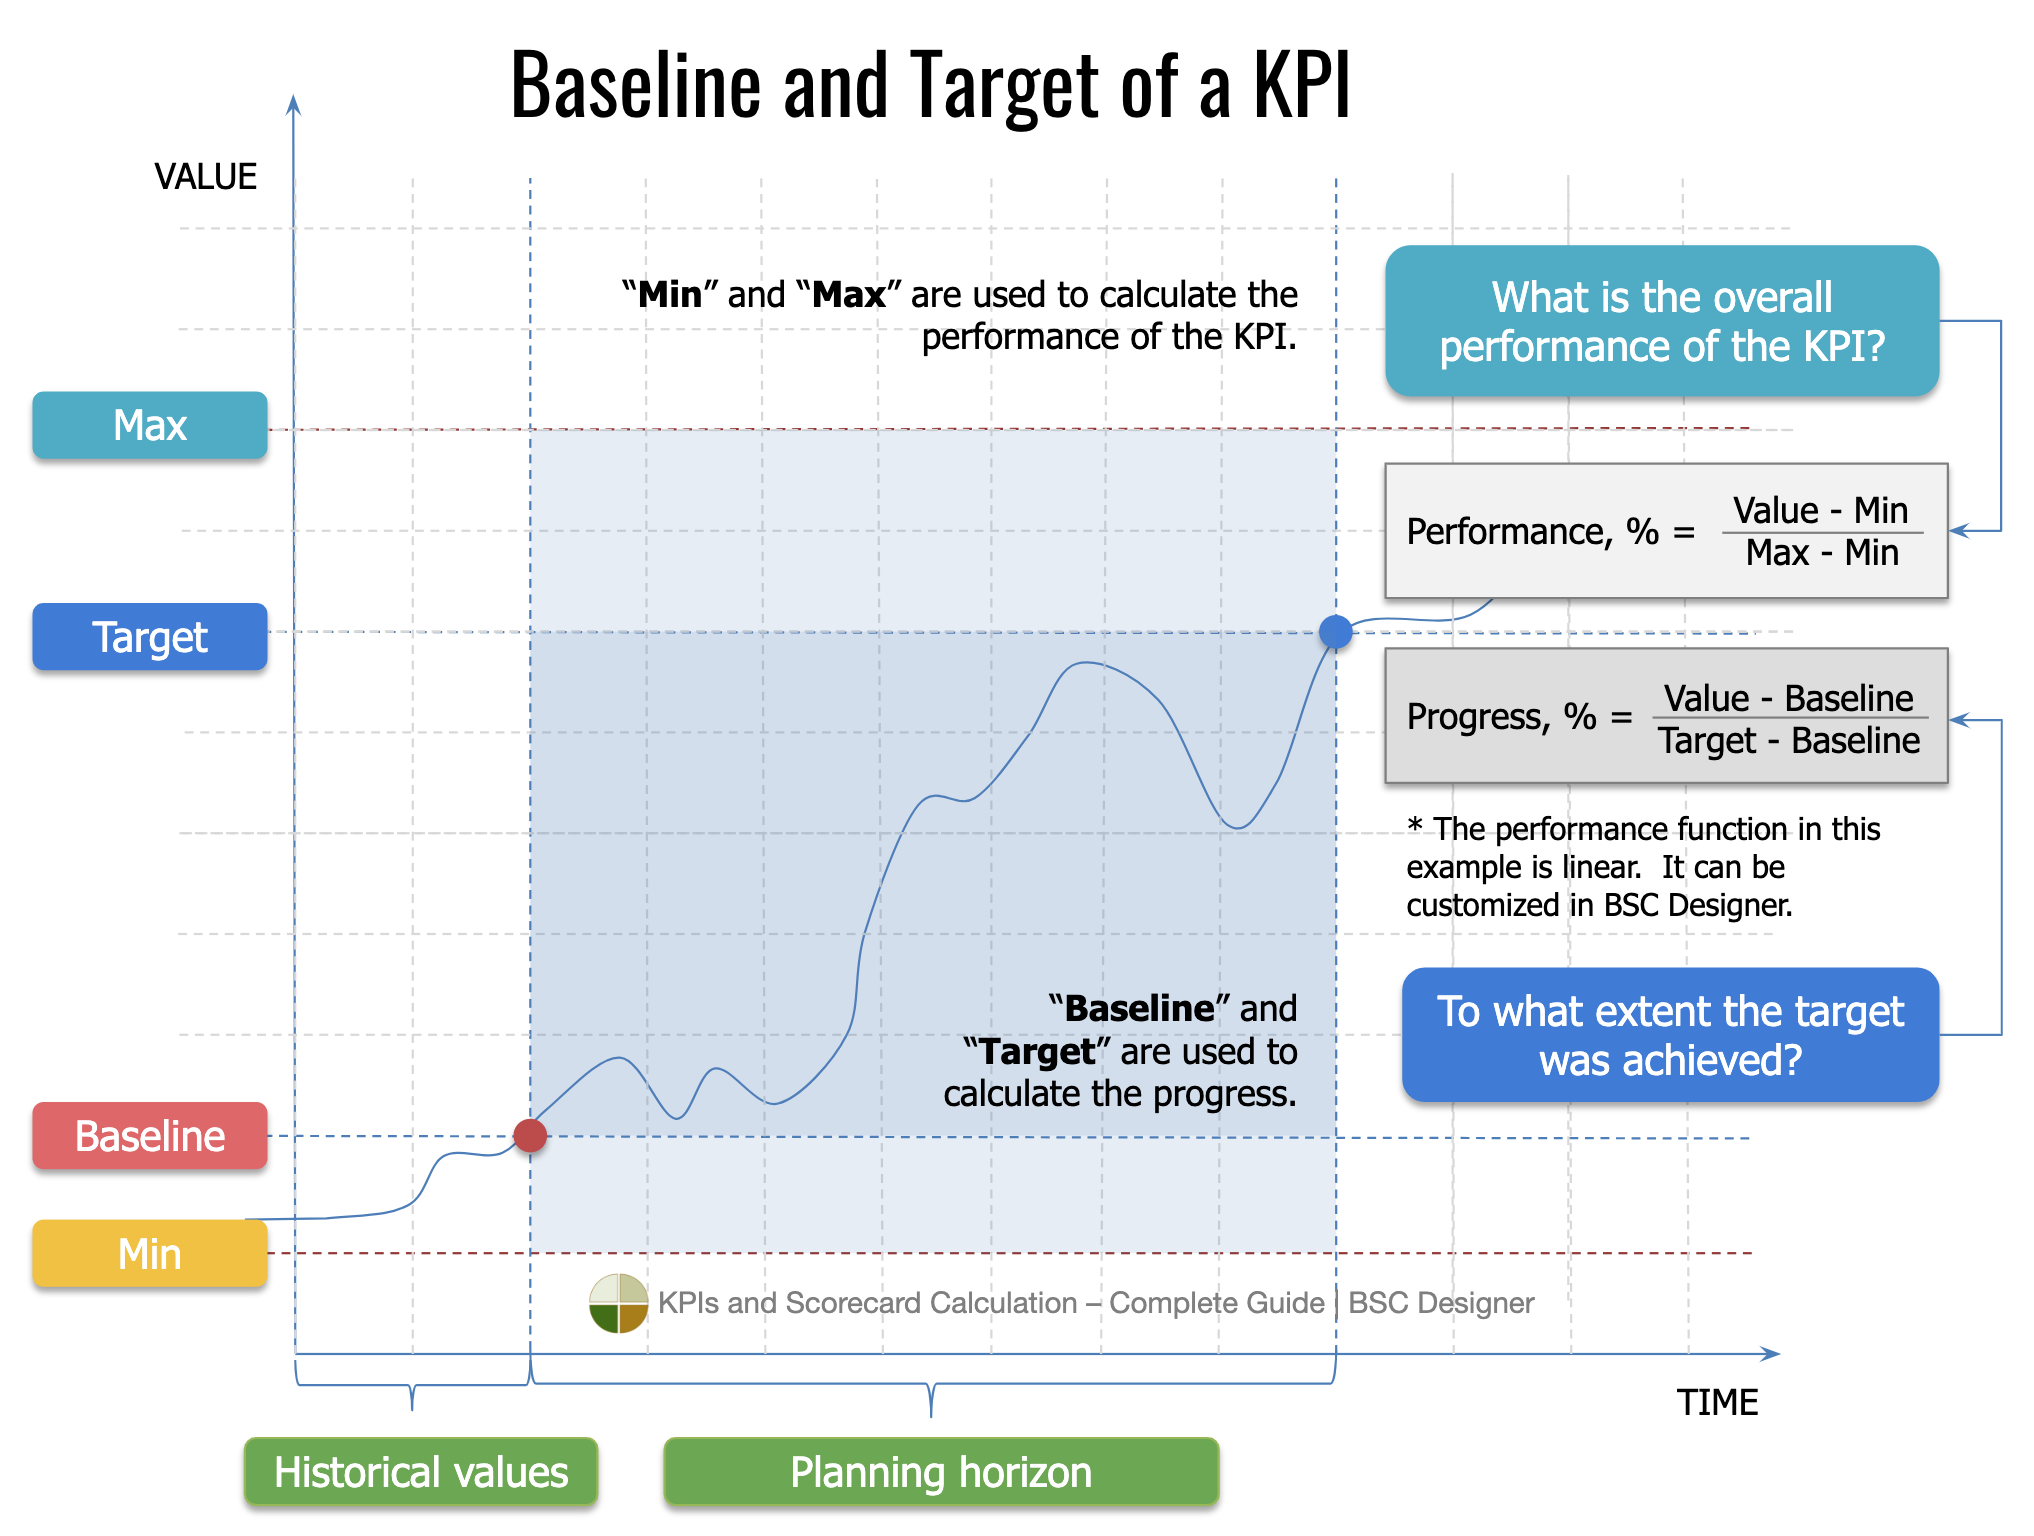
For a proposed analytics product, “baseline” can mean three related but distinct things:
| Baseline type | Question it answers | Example |
|---|---|---|
| Business-process baseline | What happens today, before the initiative? | A retention team completes contact attempts for 78% of its daily queue; the queue is available by 08:30 on 85% of weekdays. |
| Decision baseline | How does the current workflow choose or prioritise cases? | Accounts are selected using a manually maintained rule based on contract expiry and recent complaints. |
| Technical baseline | How well does a simple or existing predictive method perform? | The current rule identifies eventual churn in 24% of the top 300 accounts selected each day. |
A project may need all three. A new model that beats a simple heuristic in offline evaluation may still fail if it cannot reach users on time, if users do not act on it, or if it does not improve the business outcome.
The point is not to build an elaborate benchmark suite. It is to avoid an empty comparison such as: “Our model has 0.81 AUC, so it is successful.” An AUC might be technically respectable, but it does not establish whether the current rule is already adequate, whether specialists can use the output, or whether the intervention improves retention.
6. Baselines - ML Projects - Full Stack Deep Learning
Watch 6. Baselines - ML Projects from The Full Stack for a compact explanation of why baselines act as a performance floor and why stronger, realistic baselines are more useful than arbitrary ones.
Watch why baselines matter for the idea of a performance floor. Then watch baseline sources, focusing on the distinction between external requirements, existing rules, simple models, and human performance as comparison points.
A useful leadership question is:
What would we do, and what result would we expect, if this initiative did not exist?
The answer supplies the comparator. Without it, “improvement” is mostly a presentation choice.
Capture a defensible before-state
A baseline must be specific enough that another person can reproduce it later. “Handle times are too high” or “the current process is inefficient” is a diagnosis, not a baseline.
A defensible baseline includes:
- Metric definition — exactly what is counted, including numerator and denominator.
- Population — which customers, cases, products, regions, or teams are included and excluded.
- Time window — for example, the prior 90 calendar days, excluding a documented system outage.
- Current value and variation — not just an average, but enough distributional information to understand typical and difficult cases.
- Data source and owner — the dashboard, CRM extract, warehouse table, or audited operational report.
- Known limitations — changes in process, missing data, seasonal effects, or inconsistent definitions that may affect interpretation.
For an operational time metric, use more than a mean. The median captures a typical case; the P90 describes the slower tail, meaning 90% of cases are completed at or below that duration. A healthy median can hide an unacceptable experience for one in ten customers.
Define value before you build your agent
Microsoft Learn’s guide is written for AI agents, but its discipline applies directly to analytics initiatives: quantify the before-state before technical work begins, and preserve enough operational evidence to defend a value claim.
In “Ask four discovery questions before you build,” read the four questions, paying particular attention to the example of a quantitative handle-time baseline. Then, in “Capture your telemetry baseline before launch,” read the telemetry guidance and note the recommended dimensions: volume, time, errors, cost, and customer signal. Finally, under “How to read P90 and P99 statistics in your baseline,” read the percentile explanation.
Suppose a service operation wants to use a model to route complex cases to specialists. A weak baseline might be:
“Cases take about eight minutes to resolve.”
A usable baseline would be:
“For German-language customer-support cases created between 1 January and 31 March, median time to first substantive response was 8.0 minutes, P90 was 16.2 minutes, and 4.8% of cases were reassigned at least once. Results are based on the ticketing-system export, excluding outage-tagged incidents. The Support Operations lead owns the definitions.”
This version can be checked later. It also reveals where value may lie: perhaps not reducing the median, but reducing slow-tail response times or reassignment.
Use the right baseline for the decision
A baseline must match the initiative’s unit of analysis and decision moment.
If the proposed product ranks individual customer accounts every weekday morning, an aggregate monthly churn rate is not an adequate technical baseline. It may provide business context, but it cannot tell you whether the ranking is better than the present prioritisation method.
Likewise, historical outcomes may not be comparable across workflows. If the old system targeted customers near contract renewal and the new model targets customers with high predicted risk, a simple comparison of their eventual churn rates is misleading because the groups differ from the outset.
Where the initiative changes an intervention, the strongest value comparison is generally a contemporaneous control group or another agreed evaluation design. You will study how to design and analyse such comparisons in the statistics and experimentation module. At this stage, the important habit is to state the limitation clearly:
“Historical rule performance is a technical comparator for the ranking. A controlled pilot is needed to establish whether acting on the ranking improves retention.”
From metrics to acceptance criteria
A metric measures something. An acceptance criterion specifies a verifiable condition that must be met before a project proceeds, launches, or scales.
For example:
- Metric: “Daily queue publication time.”
- Weak criterion: “The queue should be available early.”
- Measurable criterion: “On at least 95% of business days during a four-week pilot, the queue is available in the CRM by 07:30 CET. If it is unavailable, users receive the existing rule-based queue by 07:45 CET.”
The criterion tells the team what evidence to collect, when to collect it, and what happens in a failure scenario.
Google’s problem-framing guidance draws a crucial distinction: business success metrics and model evaluation metrics are different. Precision, recall, calibration, and AUC can tell you whether a model behaves well on labelled data. They do not, by themselves, establish that the initiative improved a business outcome or user decision.
Framing an ML problem | Machine Learning
Read Google’s Framing an ML problem section to separate success in the business process from success on a model-evaluation metric. This distinction prevents a technically impressive model from being treated as a successful product prematurely.
In “Define the success metrics,” read the full success-metrics discussion. Focus on the examples of explicit success and failure conditions, and on the question of whether better model performance would actually move the initiative toward its business criterion.
A practical analytics initiative usually needs a small set of criteria across five layers:
| Layer | What must be demonstrated? | Example criterion |
|---|---|---|
| Data and governance | Inputs are available, valid, and allowed for the stated purpose. | Required source fields have at least 98% completeness in the pilot population; prohibited fields are absent from the feature table. |
| Technical comparison | The model or analytical method improves on a credible alternative. | On an untouched historical evaluation period, the model’s precision among the top 300 ranked accounts is at least 10% higher than the current rule. |
| Operational delivery | The output arrives in the necessary workflow, at the required scale and reliability. | The daily batch completes by 07:30 on at least 95% of working days. |
| Adoption and decision quality | Intended users can and do use the output appropriately. | Specialists either act on or record an approved override reason for at least 90% of recommended accounts. |
| Business value and guardrails | The initiative improves the primary outcome without unacceptable harm. | Retention improves by at least 3 percentage points relative to a control workflow, while complaint and opt-out rates do not worsen beyond agreed limits. |
The criteria should be few enough to govern a decision. A long dashboard is not a launch standard.
A/B Testing Metrics: What You Need to Know About Success, Driver, and Guardrail Metrics!
Watch the selected portions of Emma Ding’s A/B Testing Metrics: What You Need to Know About Success, Driver, and Guardrail Metrics! for a useful framework for distinguishing improvement metrics from protective limits. The examples use experiments, but the metric roles apply more broadly to pilots and operational analytics products.
Watch guardrail metrics to see why a positive primary result is insufficient if a major business or trustworthiness measure deteriorates. Then watch strong metric design, focusing on simplicity, unambiguous definitions, actionability, and resistance to gaming.
Primary metrics, driver metrics, and guardrails
These roles make acceptance criteria easier to design:
- A primary success metric is the outcome that justifies the initiative. For a retention initiative, it might be 60-day retention or contribution margin retained.
- A driver metric changes sooner and is plausibly connected to the primary outcome. For example, completed outreach attempts within two business days may indicate whether the queue is being used.
- A guardrail metric limits unacceptable harm or degradation. Examples include opt-out rate, complaint rate, customer-service load, decision latency, subgroup coverage, or manual-review workload.
Do not allow a driver metric to replace the real outcome. More calls completed is not automatically better retention; users may be contacting unsuitable customers, delivering an ineffective offer, or creating unnecessary customer frustration.
Also, avoid criteria that invite gaming. “Number of cases processed” can rise because staff close cases prematurely. “Model usage” can rise because a system forces users to click through a screen. Pair easily gamed measures with outcome and quality guardrails.
A worked acceptance contract: daily retention prioritisation
Return to the retention-ranking example from the previous lesson.
Decision: Each weekday morning, retention specialists decide which eligible accounts to contact within a capacity of 300 accounts per day.
Current approach: A rule-based queue uses contract expiry and a recent-service-contact flag.
Proposed approach: A daily batch model ranks eligible accounts by predicted risk of churn and publishes the highest-priority accounts in the CRM.
The initiative needs baselines at several levels:
| Measure | Baseline definition | Why it matters |
|---|---|---|
| Queue availability | Current queue is available by 07:30 on 85% of working days over the previous 90 days. | A more accurate model that arrives late fails the workflow. |
| Specialist capacity | Teams can complete contact attempts for approximately 300 accounts per day. | The output must be a prioritised queue, not a list of all high-risk accounts. |
| Current decision rule | In a held-out historical period, 24% of accounts in the daily top 300 later churned within 60 days. | This is a technical benchmark for risk concentration. |
| Customer outcome | 62% of eligible accounts in the present workflow remain active after 60 days. | This is a descriptive business baseline, not by itself proof of intervention effect. |
| Customer-protection measures | Opt-out and complaint rates for retention outreach over the same period. | The new workflow must not improve a headline outcome by damaging customer experience. |
The following acceptance criteria are illustrative; their exact thresholds should be negotiated with the sponsor, operations lead, privacy stakeholders, and delivery team.
| Gate | Acceptance criterion | Evidence and decision |
|---|---|---|
| Data readiness | Approved account, billing, and contact-preference fields are linkable for at least 12 months of history; critical fields meet pre-agreed completeness and validity checks. | Data-profiling report. If not met, narrow scope or create a data-foundation initiative. |
| Offline technical value | On a held-out historical period, the model identifies at least 10% more eventual churners in the top 300 accounts than the existing rule. | Reproducible evaluation report. This permits a pilot; it does not prove retention impact. |
| Operational reliability | The ranked queue is in the CRM by 07:30 on at least 95% of pilot weekdays; fallback to the existing queue is available on every failed run. | Pipeline logs and CRM publication records. |
| Appropriate use | Specialists record an action or an approved override reason for at least 90% of recommendations. | CRM activity records and override review. |
| Business pilot | In a pre-specified comparison with the business-as-usual workflow, estimated 60-day retention is at least 3 percentage points higher for the new workflow, with a pre-agreed uncertainty rule. | Pilot analysis. If the target is not met, investigate whether the issue is targeting, offer design, adoption, or insufficient intervention capacity. |
| Guardrails | Customer complaint and opt-out rates do not exceed the comparison workflow by more than 0.2 percentage points; relevant coverage and outcome differences are reviewed by agreed segments. | Customer-experience dashboard and governed segment review. |
Several details make this contract credible.
First, the technical target is a gate to pilot, not a declaration of business success. A churn-risk model can identify likely churners well but still fail to improve retention if the outreach has little effect. Prediction and intervention value are different claims.
Second, the business outcome is measured after the initiative is used in practice. It has a clear population, outcome window, comparator, and threshold. The following module will make this more rigorous by defining estimands, minimum practically important effects, confidence intervals, and sample sizes.
Third, the guardrails are not optional fine print. If a retention initiative gains a small amount of retention while causing a material rise in complaints, opt-outs, or unequal treatment, leaders may reasonably decide not to scale it.
Write criteria so a decision is possible
A concise template for each criterion is:
[Metric] for [defined population] must be [threshold and direction], measured from [source] over [time window], compared with [baseline or control]. [Named role] decides whether the evidence satisfies the gate.
For example:
“The proportion of eligible accounts retained 60 days after assignment must be at least 3 percentage points higher in the model-supported workflow than in the pre-specified business-as-usual comparison group. The Analytics Lead produces the analysis from the CRM and billing tables; the Retention Director and Product Owner make the scale decision.”
This formulation prevents five common mistakes:
-
Using vague language
“Improve customer experience” does not identify a metric, threshold, or evidence source. -
Confusing model quality with initiative value
“Achieve AUC above 0.80” may be a technical condition, but it does not prove the workflow creates value. -
Comparing non-equivalent populations
A historical before-and-after comparison may be distorted by seasonality, policy changes, or different customer composition. -
Setting targets without a baseline
A target of “reduce response time by 20%” is meaningless until the population, window, and starting response-time measure are defined. -
Adding guardrails after launch
If the project team must decide between higher conversion and worse complaints, costs, fairness outcomes, or service load, that trade-off should already be agreed with accountable stakeholders.
A final practical distinction: not every criterion belongs at the same moment. Use staged gates. Data readiness is assessed before building. Technical comparison comes before piloting. Operational, adoption, business, and harm outcomes are assessed during and after the pilot. This avoids demanding long-term impact before the system has even been exposed to users, while still preventing a prototype from being mistaken for a deployable product.
Key takeaways
A baseline and acceptance criteria turn an analytics idea into an accountable initiative.
- A baseline is a reproducible reference point: current process performance, the existing decision rule, or a simple technical comparator.
- Define the baseline with a metric formula, population, time window, source, variation where relevant, and known limitations.
- Separate model evaluation metrics from business success metrics. A model can beat a technical baseline without delivering business value.
- Write acceptance criteria as explicit, testable gates with a threshold, comparison point, evidence source, measurement window, and decision owner.
- Use a compact set spanning data and governance, technical quality, operational reliability, adoption, primary business value, and guardrails.
- Where an initiative changes an intervention, use a suitable pilot comparison before claiming causal business impact.
Next, you will consolidate the decisions, metrics, constraints, baselines, and acceptance criteria developed so far into a one-page project charter that sets realistic stakeholder expectations before delivery begins.
Can't find a good explanation? Sign up and we'll make it for you
Sign up