
Hello, and welcome to the first lesson of the production-ML architecture refresher. This module builds the systems-level vocabulary needed for senior ML engineering work: not only how a model is trained, but how its inputs, artifacts, deployment, predictions, and observed outcomes remain connected in production.
The key idea for this lesson is simple but often blurred in design discussions: a production prediction is one short execution path inside a much longer, continuously operating lifecycle. A model endpoint does not begin with training when a request arrives. It consumes a versioned serving contract built by upstream data and training processes, then emits evidence that feeds the next cycle of monitoring and improvement.
By the end, you should be able to narrate a prediction’s journey from source data to a monitored production decision, identify the artifacts that make the journey reproducible, and distinguish a healthy feedback loop from a collection of disconnected ML tools.
Two nested paths: building the model and serving the prediction
A useful architecture starts by separating two paths that interact but have very different latency and reliability requirements.
-
The model-production path runs on a schedule or in response to events. It ingests raw data, validates and transforms it, creates training datasets, trains and evaluates candidate models, records artifacts, and promotes approved versions.
-
The prediction-serving path runs when an application needs a decision. It validates a request, obtains the required features or context, invokes a deployed model, applies post-processing and policy, returns a response, and records observability data.
The two paths are connected by a serving contract. This is more than model weights. At minimum, it includes:
- the model artifact and its immutable version;
- the input schema, feature definitions, and preprocessing logic;
- model runtime details such as container image and dependency versions;
- output schema, thresholds, and post-processing rules;
- evaluation results and approval status;
- baseline statistics used for subsequent monitoring.
If any part of that contract is implicit, a model may be statistically valid in an experiment yet unreliable in production.
A support-ticket routing system makes the distinction concrete. A weekly or daily workflow might ingest historical cases, compute features such as product area, account tier, recent incident frequency, and text embeddings, then train a model to predict an escalation category. In contrast, an online prediction may need to return a routing recommendation within a few hundred milliseconds when a new ticket is opened. The online request cannot wait for a training pipeline, but it must use feature semantics consistent with the data used during training.
Google Cloud’s enterprise blueprint is a useful vendor-specific example of this general split between data, ML, and CI/CD responsibilities.
Build and deploy generative AI and machine learning ...
Read Google Cloud’s architecture blueprint to establish a concrete reference architecture. Focus on the separation between platform layers, the operational pipeline that produces a deployable model, and the operational metrics collected after deployment.
First, read the “Enterprise generative AI and ML blueprint overview” section, from the layered overview. Notice that data capabilities, ML capabilities, and CI/CD are complementary layers rather than interchangeable services. Then read the “Operational environment” subsection and its numbered “A typical operational flow” list. Follow the complete operational flow, especially data transfer, transformation, training, evaluation, registry import, prediction, and drift monitoring. Finally, in the “Cloud Monitoring” section, read the monitoring metrics. Separate training-job observability from deployed-service observability; both are necessary, but they answer different questions.
From source data to a training-ready dataset
The lifecycle begins with data acquisition, not with a notebook or model class. Sources may be application databases, event streams, logs, documents, warehouse tables, third-party feeds, or labeled human-review outcomes. In a robust design, ingestion establishes four properties before ML-specific work begins:
- Identity and lineage: Where did the record originate, when was it observed, and which source version produced it?
- Data contract compliance: Does the schema, type, range, allowed vocabulary, and freshness meet expectations?
- Retention and access controls: Can the data be stored and used under its privacy, security, and regulatory constraints?
- Recoverability: Can the pipeline be replayed from an immutable or reconstructable source if a downstream job fails?
Raw data is generally retained separately from transformed ML-ready data. This makes debugging possible: if a feature looks wrong, the team can determine whether the error appeared at source, during ingestion, or during transformation.
Feature construction and the serving contract
Feature engineering converts source records into variables a model consumes. The feature layer is where many production failures originate because the model is sensitive not only to values, but to their meaning and timing.
For every feature, define:
| Property | Example: open_incidents_last_30d | Why it matters |
|---|---|---|
| Entity key | customer_id | Ensures the value belongs to the correct customer |
| Event time | Time at which incidents occurred | Prevents use of future information |
| Freshness expectation | Updated hourly | Establishes acceptable staleness |
| Transformation version | SQL or Python transformation digest | Supports reproducibility |
| Missing-value behavior | Use 0 only when no incidents are confirmed | Avoids conflating unknown with none |
| Online availability | Required for synchronous ticket routing | Determines serving design |
For supervised learning, a training row must represent what was knowable at the prediction time. If a historical support ticket is labeled with its eventual escalation outcome, then features used to predict that outcome must exclude events that occurred after the ticket was created. This is the point-in-time correctness requirement. Violating it causes label leakage and produces deceptively strong offline evaluation.
A feature store can help provide shared feature definitions and separate offline and online access paths, but it is not mandatory in every system. The architectural requirement is more fundamental: training and serving must use the same semantic definitions, including defaults, normalization, joins, and timestamp rules.
MLOps with Feature Store - Move models from development to production
Watch “MLOps with Feature Store - Move models from development to production” from AIEngineering for a compact visual account of how feature pipelines, training pipelines, and deployment fit together. The product-specific terminology is less important than the data dependencies.
Watch the MLOps flow to contrast scheduled batch prediction with operational online serving and to see why features sit between enterprise data and models. Then watch pipeline dependencies. Focus on the distinction between feature pipelines, which maintain reusable data products, and training pipelines, which assemble a versioned dataset and produce a model. Skip any intervening platform-specific material.
A practical design rule is:
Version the feature definition and the data snapshot separately.
The same feature code may be executed against different data snapshots, and the same snapshot may be transformed differently after a feature-definition change. A senior-level incident investigation often needs both pieces of information.
Training, evaluation, registration, and promotion
Once a versioned training dataset is available, the training workflow produces much more than a serialized model file. A candidate model should be accompanied by a lineage record that answers:
- Which source datasets, feature versions, and label definitions were used?
- Which code revision, environment, and hyperparameters produced the artifact?
- Which evaluation dataset and slices were used?
- What metrics, calibration checks, fairness checks, robustness tests, and latency benchmarks were passed?
- Which person or automated policy approved this model for the next environment?
A model registry is the system of record for this release state. It should store an immutable model version, link it to artifacts and evaluation results, and maintain a lifecycle state such as candidate, validated, staged, approved, deployed, or retired. The registry is not merely a file directory. Its job is to make promotion deliberate and auditable.
The TensorFlow Extended pipeline diagram illustrates this idea as a sequence of components: examples are ingested, statistics and schema are produced, data is validated and transformed, a model is trained and evaluated, infrastructure is validated, and a pusher makes an approved artifact available for serving.
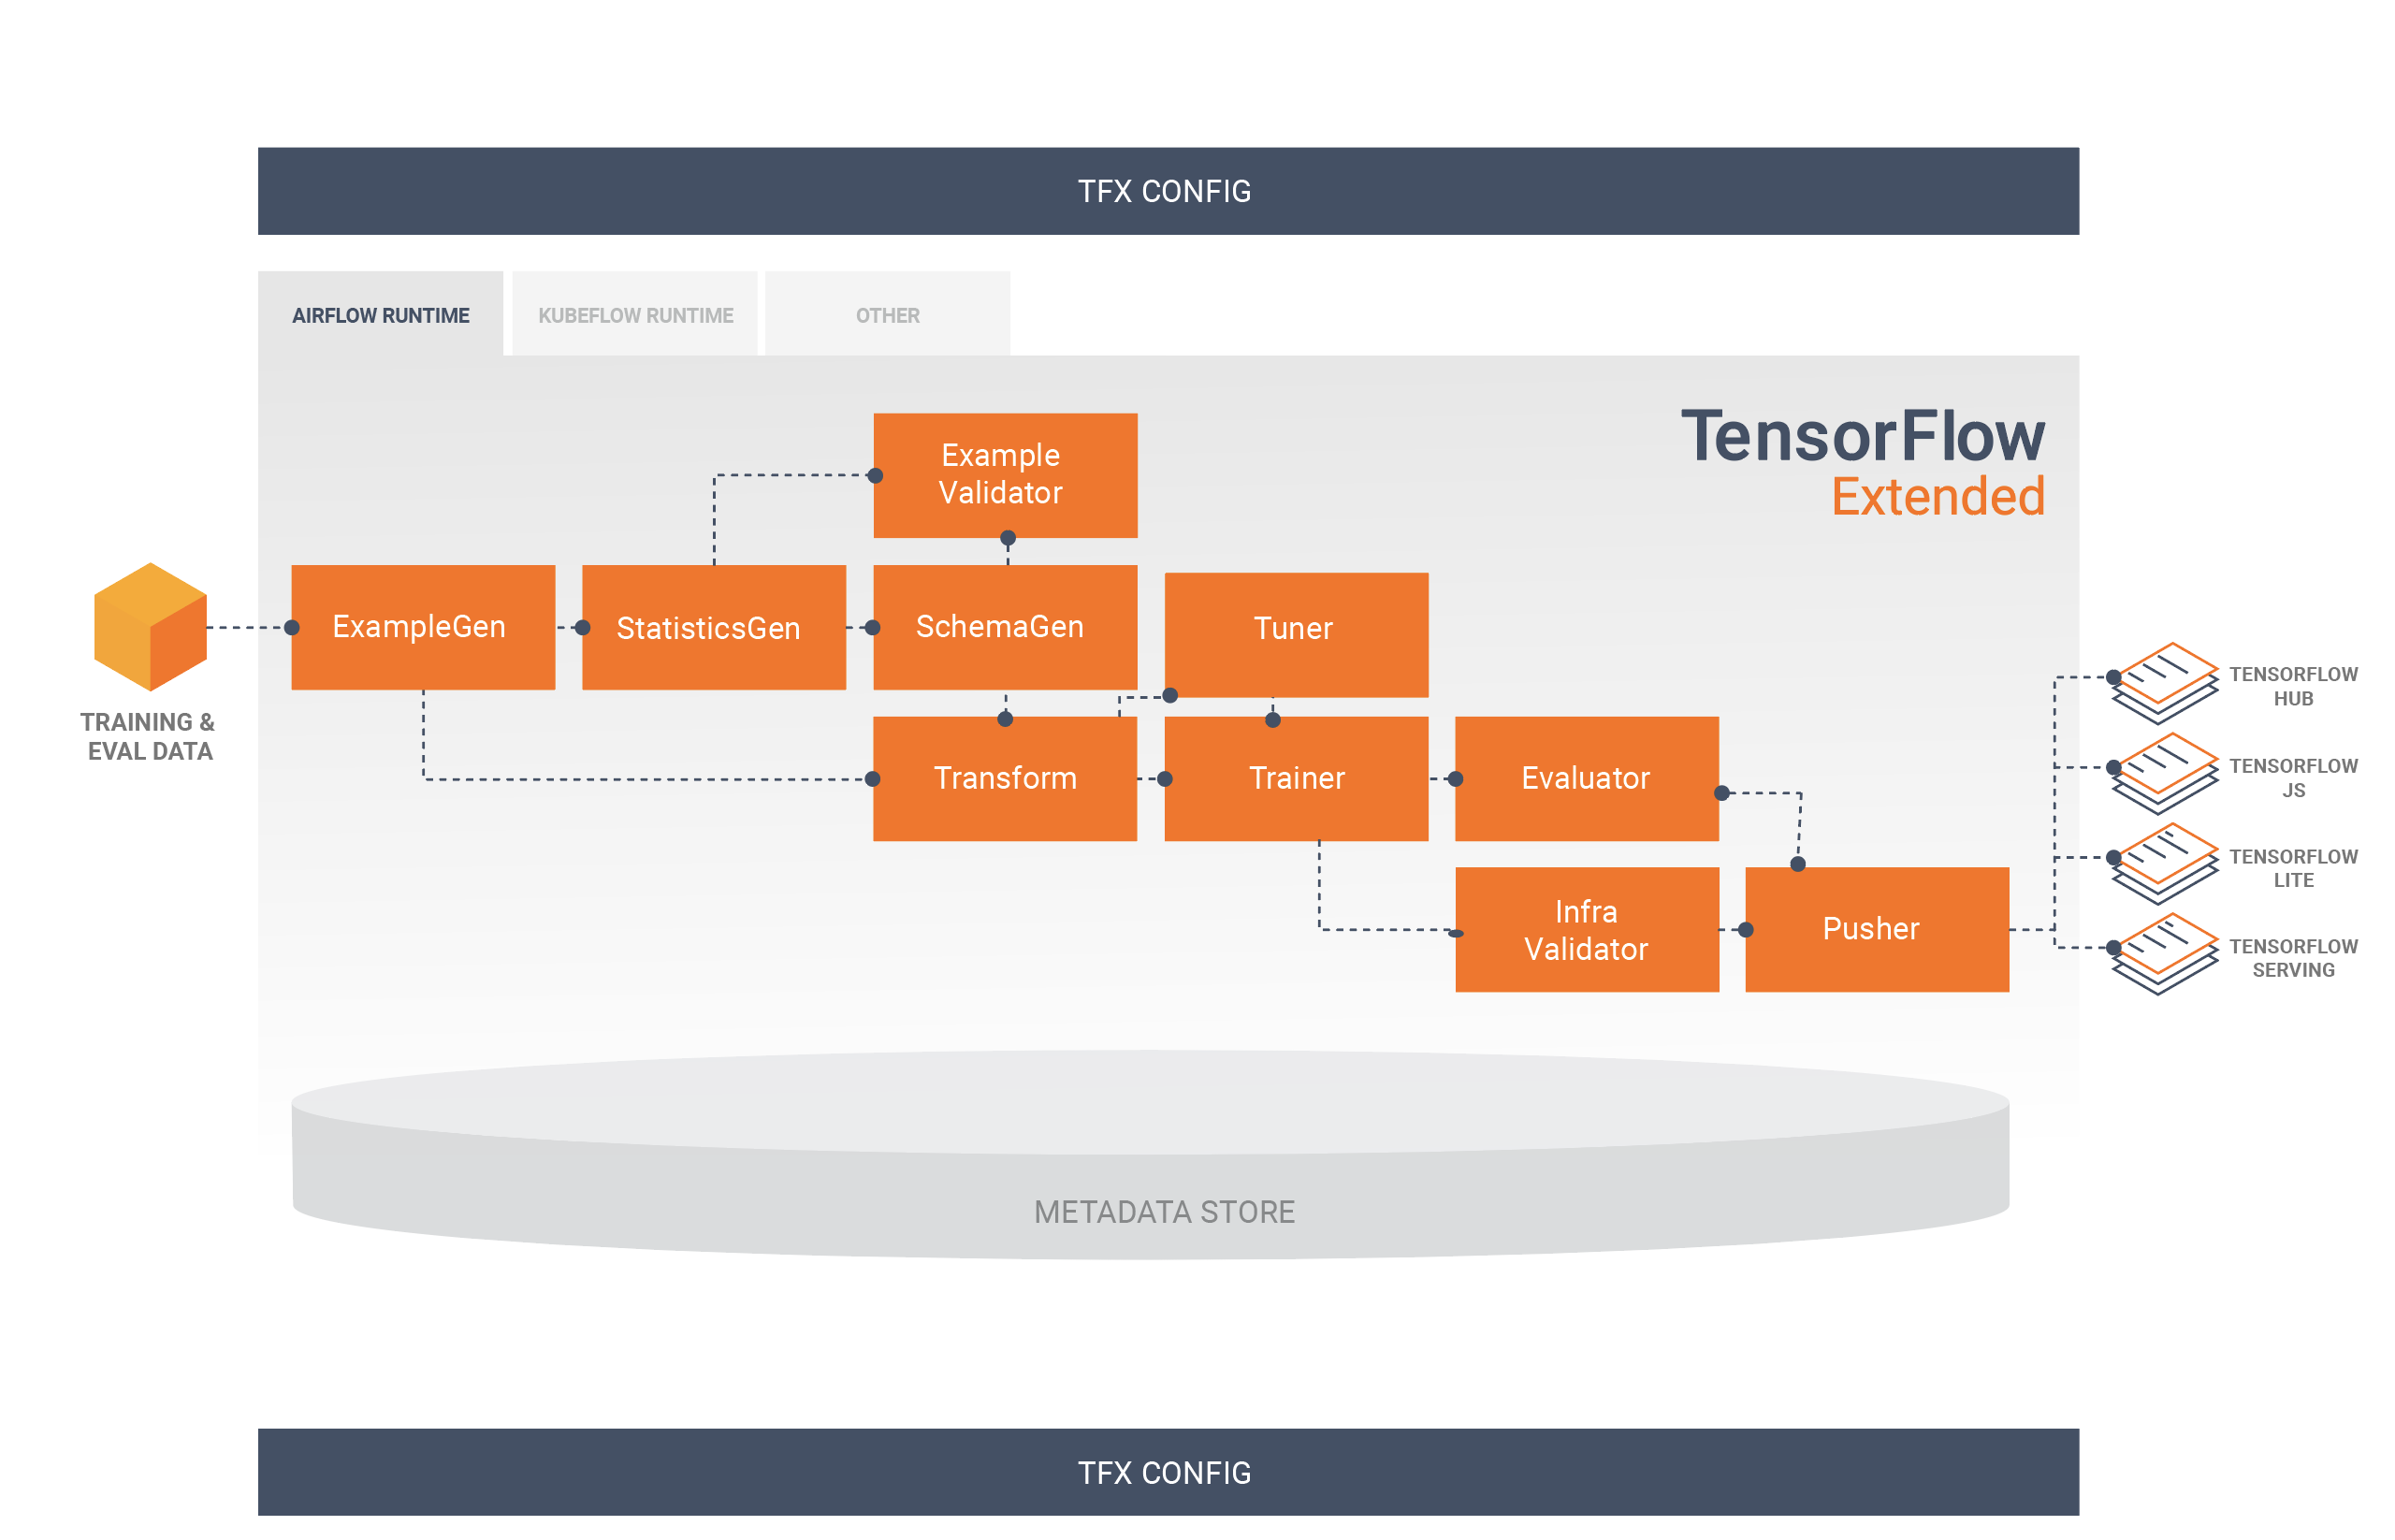
The exact tooling is optional. The architectural functions are not:
| Function | Essential output |
|---|---|
| Data validation | Accepted or rejected data snapshot with quality report |
| Dataset construction | Point-in-time-correct, versioned training and evaluation data |
| Training | Candidate model artifact and run metadata |
| Evaluation | Quality, robustness, and slice-level evidence |
| Registry | Immutable version, lineage, approval state |
| Deployment | Serving configuration tied to that approved version |
Staging is a distinct environment, not a label
Before production, deploy the same artifact and as much of the same serving configuration as possible to staging. Staging tests integration properties that offline evaluation cannot establish:
- Does the endpoint load and initialize under its production resource limits?
- Does preprocessing accept real application payloads?
- Can the service fetch the required online features?
- Are latency and throughput acceptable under load?
- Are authentication, authorization, logging, and rollback mechanisms functioning?
Only after these checks should a deployment mechanism promote the known model version to production. A mature platform can use canary, shadow, or controlled rollout patterns, but the core principle stays constant: deployment changes should be attributable to a specific approved artifact and configuration.
The online prediction path
Now consider the path taken by one live support ticket. Its lifecycle should be traceable with a request identifier from application entry through model response and eventual outcome.
-
Application request and gateway. The application submits a request with the ticket payload and a correlation ID. A gateway or inference service authenticates the caller, validates the payload schema, applies rate limits, and attaches trace context.
-
Feature or context assembly. The inference service derives request features and retrieves entity features that must be current, such as customer tier or recent incident counts. For a GenAI system, this step can also include prompt construction and retrieval of approved context; the equivalent contract includes prompt-template and retrieval configuration versions.
-
Preprocessing. The service performs the same logical transformations used to create model inputs during training: tokenization, categorical encoding, normalization, embedding lookup, missing-value handling, and feature ordering. The implementation need not literally be the same process, but the behavior must be equivalent and tested.
-
Model execution. The runtime invokes a specific deployed model version. Record timings that distinguish queueing, feature retrieval, preprocessing, inference, and post-processing. A single “endpoint latency” number is useful but insufficient for diagnosis.
-
Post-processing and decision policy. Raw scores may be calibrated, thresholded, filtered, joined with business rules, or converted into a structured action. For example, a escalation-risk score might trigger a priority queue only if the account also has an eligible support plan.
-
Response and asynchronous evidence capture. The application receives a decision. Separately, the platform records request metadata, feature-quality indicators, model version, output, latency, and relevant policy version. Sensitive raw content should be minimized, access-controlled, or redacted rather than indiscriminately logged.
The prediction log must be designed for later joins. A useful minimum record resembles:
| Record field | Purpose |
|---|---|
| Request and trace ID | Connects gateway, feature, model, and application events |
| Timestamp and entity key | Supports temporal analysis and eventual label joining |
| Model and deployment version | Identifies exactly what produced the prediction |
| Feature or context version | Detects stale or incompatible serving inputs |
| Prediction and decision | Separates raw model output from downstream policy |
| Latency and error status | Measures service reliability |
| Outcome reference | Enables later quality measurement when labels arrive |
Notice the difference between a prediction and a business outcome. The system knows its model score immediately. It may not know whether its ticket-routing recommendation was correct until an engineer resolves the ticket days later. Consequently, real production quality is frequently delayed, incomplete, or selectively observed.
Monitoring closes the lifecycle
Monitoring is the mechanism that turns a deployed model into a maintained service. It should operate across four distinct surfaces.
| Monitoring surface | Example signals | What it can reveal |
|---|---|---|
| Service health | Error rate, availability, queue depth, latency, CPU/GPU or memory use | Outages, overload, resource exhaustion |
| Input quality | Schema violations, null rate, freshness, feature distribution changes | Broken producers, stale features, covariate shift |
| Prediction behavior | Score distributions, class proportions, abstention rate, threshold crossings | Unexpected model behavior or upstream shifts |
| Outcome quality | Accuracy, precision/recall, calibration, business KPI, slice metrics | Actual degradation once labels arrive |
These are related but not interchangeable. A system can have perfect uptime and low latency while making poor decisions. Conversely, a temporary shift in input distribution does not prove that model quality has fallen; it is a signal to investigate.
Drift, skew, and performance degradation
Three terms deserve careful separation:
-
Data drift is a change in input distribution, often described as a shift in . For example, the fraction of tickets from a new product line rises sharply after launch.
-
Prediction drift is a change in the distribution of model outputs. It may be caused by input shifts, a deployment bug, threshold changes, or real changes in the population.
-
Concept drift or performance degradation occurs when the relationship between inputs and desired outcomes changes, commonly framed as a change in . A support organization may change its escalation policy, making historical routing patterns less predictive.
-
Training-serving skew means the training and production paths do not generate equivalent inputs or behavior. For example, a training pipeline computes a rolling feature using event time, while serving accidentally uses processing time; or production uses a new categorical value that was absent from the encoder used in training.
Drift is often a property of the world changing over time. Skew is usually a system implementation defect. Both can degrade quality, but their remedies differ.
The AWS diagram below emphasizes an important production detail: the prediction data can be monitored soon after inference, while ground truth may arrive later and must be merged before performance can be measured.

A monitoring baseline should be versioned with the deployment. If model version was trained using a particular feature distribution and schema, its monitoring jobs must know which baseline applies to , not compare it indiscriminately with statistics from an older model.
Monitoring must lead to an operating decision
An alert is not a corrective action. Define the expected response for each significant signal:
| Signal | Initial response | Possible decision |
|---|---|---|
| Input schema violation | Identify producer and reject, quarantine, or safely default invalid requests | Fix upstream contract or rollback producer |
| Feature freshness breach | Determine scope and affected entities | Use safe fallback, pause automated decisions, repair pipeline |
| Input drift alert | Check data-source changes and predicted-output behavior | Update baseline, collect labels, or begin candidate retraining |
| Outcome metric decline | Check label quality, segment concentration, policy changes, and skew | Roll back, recalibrate, retrain, or change policy |
| Latency or error spike | Inspect queueing, dependency latency, capacity, and deployment changes | Scale, shed load, rollback, or fail over |
Avoid automatically retraining on every drift alert. A drift detector identifies statistical change, not necessarily a valid new training target. Automatic retraining without label-quality checks, evaluation gates, and promotion controls can simply automate a regression.
A complete trace: ticket routing in production
Here is the lifecycle as a connected narrative.
Historical ticket events, customer records, product telemetry, and resolution labels are ingested under data contracts. The platform retains a raw, access-controlled record and produces validated feature tables with event timestamps. A training workflow builds point-in-time-correct datasets, trains an escalation-routing model, evaluates it on a later temporal holdout and relevant customer segments, then registers the artifact with its feature definitions, code version, image digest, metrics, and approval evidence.
The model is deployed to staging, where realistic application payloads and online feature retrieval are tested. An approved immutable version is then promoted to production.
When a customer opens a ticket, the application sends the ticket payload to the routing service. The service validates the request, fetches current customer features, applies the versioned transformations, invokes the deployed model, applies the queue-selection policy, and returns a routing result. The platform records the request’s model version, feature freshness, output, decision, and latency.
Several days later, the ticket’s actual resolution and escalation outcome become available. The monitoring pipeline joins those outcomes to prediction records. It measures actual routing quality overall and by segment, while also comparing current inputs and predictions with the baseline. If a new product launch changes ticket language and categories, input drift may be detected immediately. If routing accuracy falls after delayed labels arrive, the team can diagnose whether the cause is concept drift, a changed label policy, or a training-serving mismatch. Only then does the next candidate-training and promotion cycle begin.
This trace is the core answer to “what happens after we deploy the model?” Deployment is not the end of the lifecycle; it is the point at which production evidence begins.
Key takeaways
A production ML prediction is supported by a continuous system of data, artifacts, controls, and feedback:
- The training path creates a versioned serving contract from ingested and validated data.
- The serving path uses that contract to turn a live request into a decision with traceable evidence.
- A registry and promotion process connect a deployed version to its code, data, evaluation, and runtime configuration.
- Monitoring must distinguish service health, input quality, prediction behavior, and delayed outcome quality.
- Drift, performance degradation, and training-serving skew are different failure modes and should not trigger the same response automatically.
- The feedback loop is complete only when production predictions can be joined to observed outcomes and used to make controlled model-update decisions.
Next, we will compare batch, streaming, and online inference. That lesson will use this lifecycle as its foundation and focus on how latency, throughput, freshness, and consistency requirements change the serving architecture.
Can't find a good explanation? Sign up and we'll make it for you
Sign up