
Unit 1 Study Guide Practice Test: 50 Questions with Explanations and Accuracy Flags
Hello. With the test tomorrow and only about an hour to prepare, this lesson is designed as a rapid, closed-book multiple-choice practice test, with special attention to maps, hemispheres, and the five themes of geography.
Important accuracy note: the original 50-question study-guide list was not included here. This is therefore an aligned reconstruction based on the Unit 1 topics in the provided materials, rather than a word-for-word conversion of that list. It covers the major concepts most likely to appear: maps, coordinates, regions, spatial patterns, human–environment interaction, and the five themes.
Fast refresher before the test (about 12–14 minutes)
If time is tight, do not try to memorize every sentence. Watch these two short review segments, then take the practice test without notes.
Five Themes Of Geography (AP Human Geography)
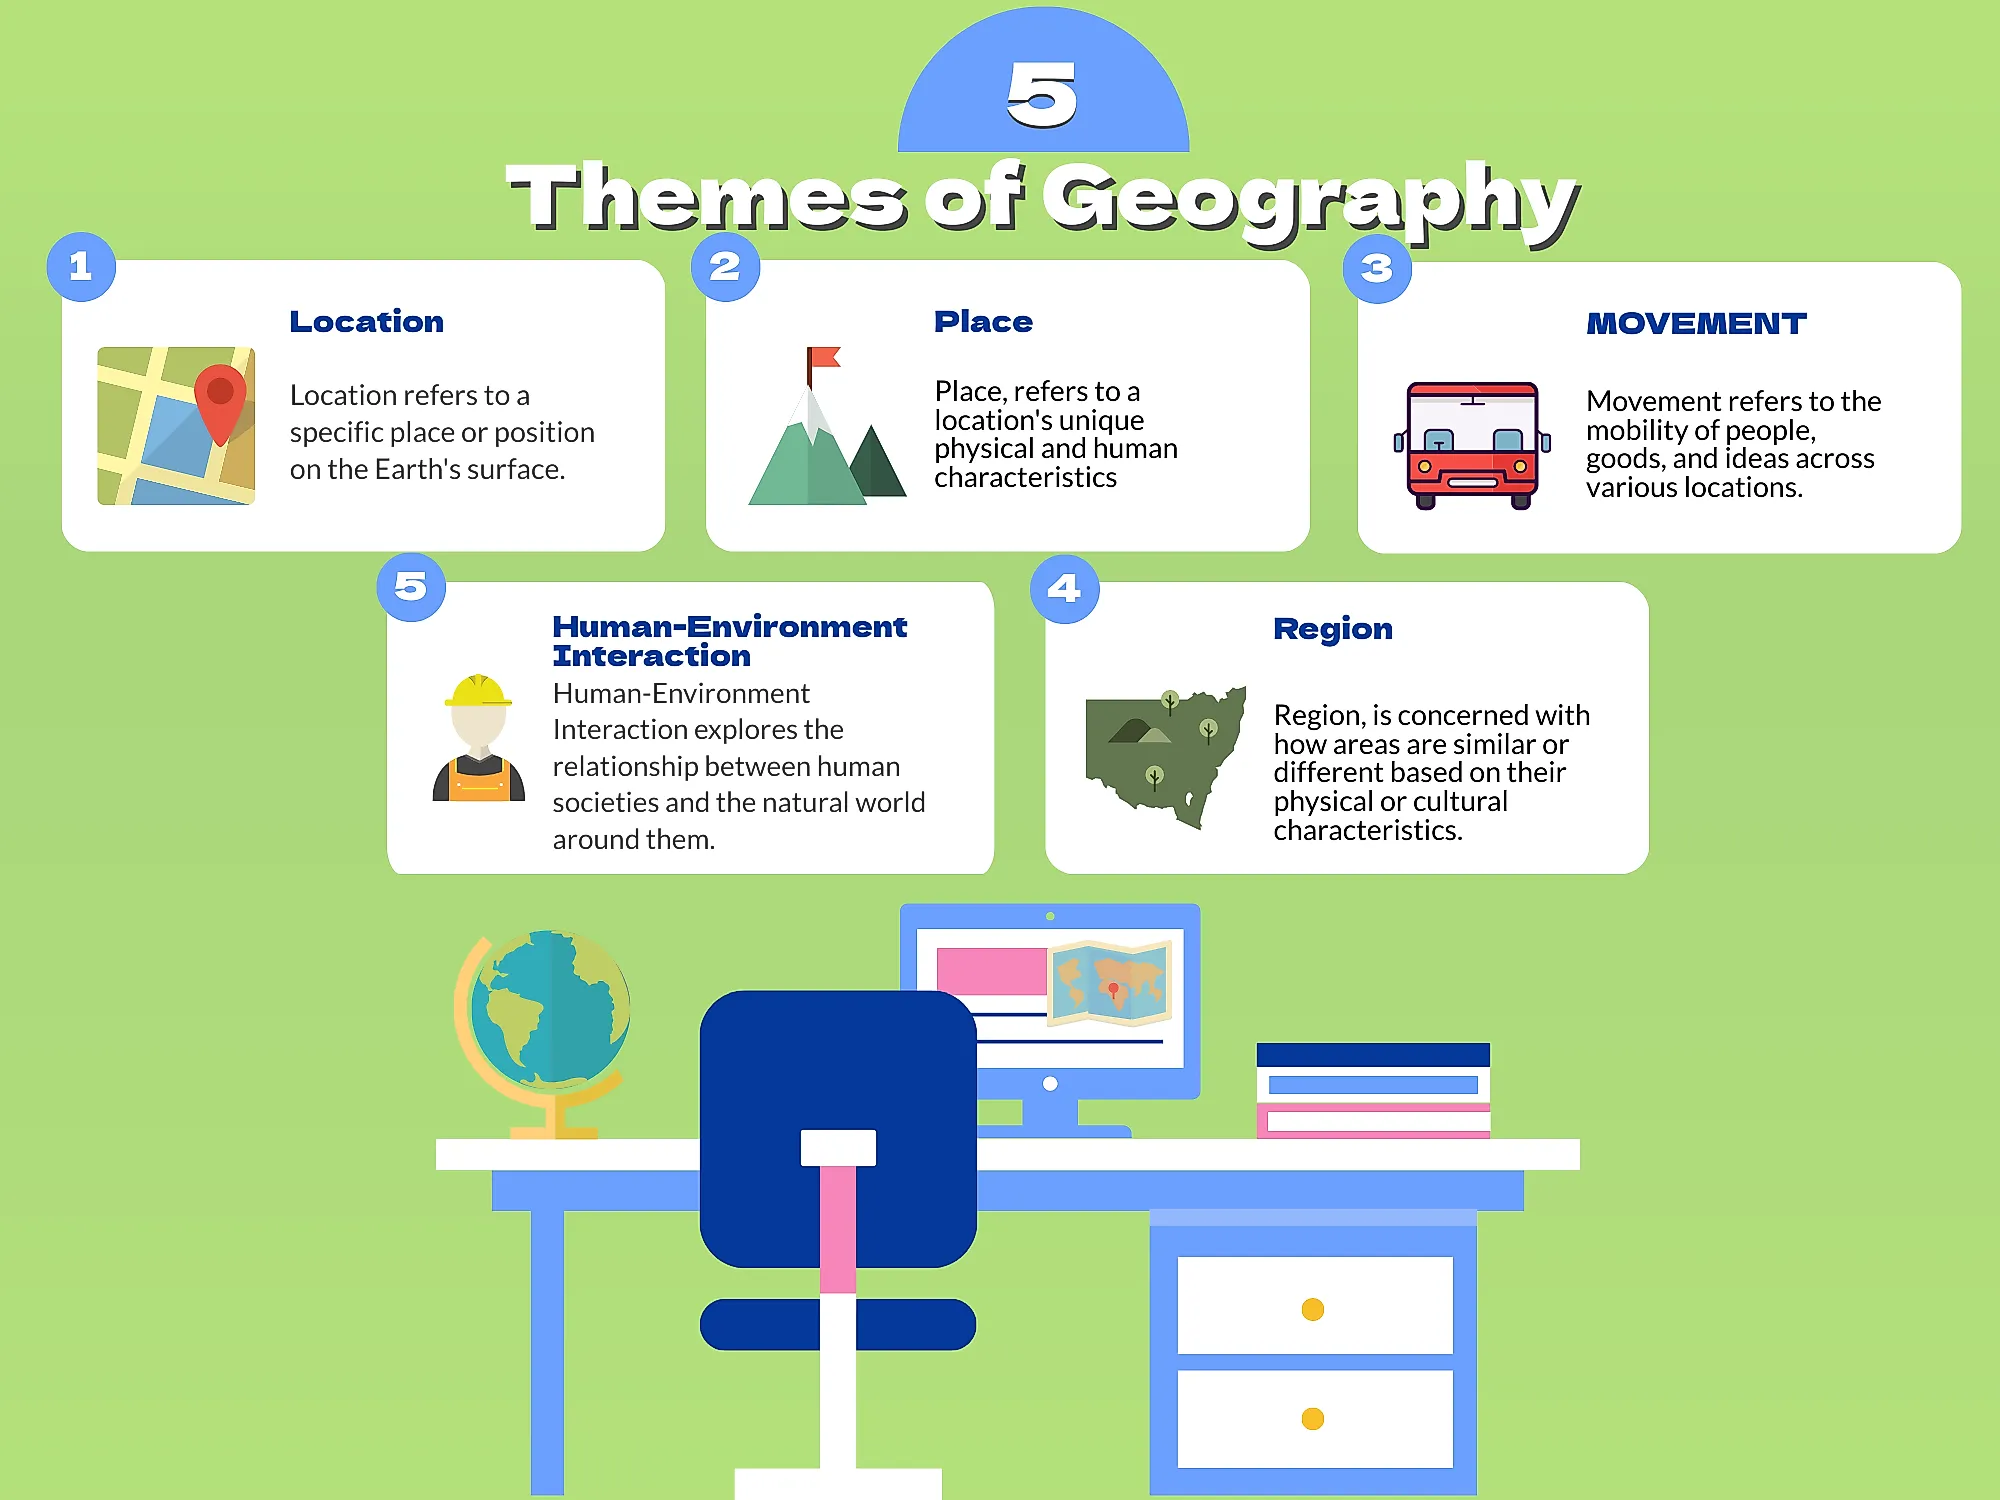
Watch “Five Themes Of Geography (AP Human Geography)” by Mr. Sinn for a compact review of Movement, Region, Human–Environment Interaction, Location, and Place.
Watch the overview to hear the five themes named. Then watch the five themes straight through. Focus on identifying the clue words in an example: coordinates signal location; unique physical or cultural traits signal place; exchange across places signals movement; shared characteristics signal region; and mutual effects between people and nature signal human–environment interaction.
AP HUMAN GEO Unit 1 Review [EVERYTHING You NEED to Know]
Watch “AP HUMAN GEO Unit 1 Review” by Heimler's History for the map concepts most likely to create multiple-choice traps.
Watch spatial patterns for distance, direction, clustering, dispersal, and elevation. Continue with map elements, especially the counterintuitive distinction between large- and small-scale maps. Then watch map types and projections. Focus on matching each map type or projection to its purpose and main distortion.
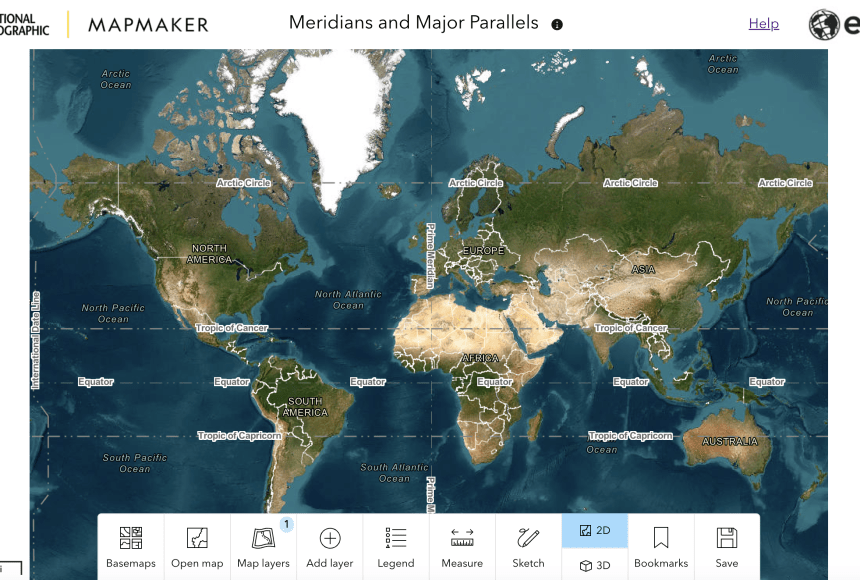
Keep these two visuals in mind during the test:
Last-minute memory anchors
- Latitude runs east–west but measures distance north or south of the Equator.
- Longitude runs from pole to pole and measures distance east or west of the Prime Meridian.
- Large-scale map: smaller area, more detail.
- Small-scale map: larger area, less detail.
- MR. HELP: Movement, Region, Human–Environment Interaction, Location, Place.
50-question practice test (about 25–30 minutes)
Use a separate sheet or notes app. Write only the question number and letter. Do not check the answer key until you finish.
Maps, scale, and spatial patterns
1. Geographers use maps mainly to analyze
A. only political borders
B. spatial patterns, or how features are arranged across Earth
C. the personal opinions of mapmakers
D. events that happened only in the past
2. A map scale of means that
A. one unit on the map represents 100,000 of the same units on Earth
B. one inch on the map represents 100,000 miles
C. the map is always a large-scale map
D. the map has no distortion
3. Which map would most likely be a large-scale map?
A. A world map showing climate zones
B. A map of the United States
C. A detailed street map of one neighborhood
D. A map of all continents
4. What is the main purpose of a compass rose?
A. To show elevation
B. To show direction
C. To calculate population
D. To identify map projection
5. A road map showing highways, rivers, and city locations is primarily a
A. reference map
B. cartogram
C. choropleth map
D. dot-density map
6. A map shades each state from light to dark based on its unemployment rate. This is a
A. choropleth map
B. topographic map
C. reference map
D. graduated-symbol map
7. A map uses one dot to represent every 1,000 residents in an area. This is a
A. dot-distribution map
B. cartogram
C. isoline map
D. political map
8. A map uses circles of different sizes to show the population of cities. This is a
A. choropleth map
B. graduated-symbol map
C. physical map
D. contour map
9. A weather map connects places with equal air pressure. It is best described as an
A. isoline map
B. cartogram
C. dot-distribution map
D. reference map
10. A map changes the sizes of countries so that highly populated countries look larger. This is a
A. cartogram
B. Mercator projection
C. physical map
D. large-scale map
11. Why is distortion unavoidable on a flat world map?
A. Cartographers do not know Earth’s shape.
B. A three-dimensional globe cannot be flattened without changing some properties.
C. Every map has incorrect labels.
D. Latitude and longitude cannot be shown together.
12. Which projection is especially useful for navigation because it preserves direction locally but greatly enlarges land near the poles?
A. Mercator
B. Peters
C. Robinson
D. Polar-area cartogram
13. Which projection attempts to preserve the relative area of landmasses, even though shapes may look stretched?
A. Mercator
B. Peters
C. Robinson
D. Topographic
14. Which projection is designed as a compromise, spreading distortion across the map rather than perfectly preserving one property?
A. Robinson
B. Peters
C. Mercator
D. Polar
15. Houses located close together in a subdivision show a
A. clustered distribution
B. dispersed distribution
C. random distribution
D. linear distribution
16. Farms spread far apart across a rural area show a
A. clustered distribution
B. dispersed distribution
C. nodal distribution
D. contour distribution
17. Homes built along a highway most clearly show a
A. random distribution
B. linear distribution
C. dispersed distribution
D. polar distribution
18. On a topographic map, contour lines that are very close together indicate
A. a gentle slope
B. a steep slope
C. sea level
D. a political boundary
Location, latitude, longitude, and geospatial data
19. The exact coordinates of a location, such as , describe its
A. relative location
B. absolute location
C. perceptual location
D. functional location
20. Which statement is an example of relative location?
A. “The school is at .”
B. “The school is 3 miles east of the library.”
C. “The school has brick walls.”
D. “The school is in the Northern Hemisphere.”
21. Lines of latitude are also called parallels because they
A. run parallel to the Equator
B. meet at the North Pole
C. mark political boundaries
D. measure east and west distance
22. Lines of longitude are also called meridians and are used to measure
A. distance north and south of the Equator
B. distance east and west of the Prime Meridian
C. elevation above sea level
D. distance from the coast
23. A location at is in the
A. Northern and Western Hemispheres
B. Northern and Eastern Hemispheres
C. Southern and Western Hemispheres
D. Southern and Eastern Hemispheres
24. The Equator divides Earth into the
A. Eastern and Western Hemispheres
B. Northern and Southern Hemispheres
C. Arctic and Antarctic regions
D. Old World and New World
25. The Prime Meridian is the usual starting reference for measuring
A. latitude
B. longitude
C. elevation
D. climate
26. GPS is most useful for
A. finding precise location and navigation routes
B. changing the size of countries on a map
C. identifying people’s opinions about a region
D. drawing contour lines by hand
27. GIS is best described as
A. a system for analyzing and combining layers of geographic information
B. a satellite that gives directions
C. a map projection that preserves area
D. a type of region
28. Satellite images used to monitor wildfires are an example of
A. remote sensing
B. relative distance
C. perceptual mapping
D. possibilism
29. “There are 2,500 people living in this neighborhood” is
A. qualitative data
B. quantitative data
C. perceptual data
D. vernacular data
30. “Residents say traffic makes the neighborhood feel unsafe” is
A. quantitative data
B. qualitative data
C. absolute-location data
D. elevation data
Five themes of geography
31. A company ships phones from South Korea to Brazil. Which theme is most directly involved?
A. Place
B. Movement
C. Region
D. Location
32. A geographer studies how a river, climate, languages, and food traditions make one city distinctive. Which theme is this?
A. Place
B. Movement
C. Region
D. Absolute location
33. A statement that “a town is located at ” addresses which theme?
A. Region
B. Location
C. Place
D. Human–environment interaction
34. A study groups places together because they share a language, religion, climate, or political boundary. Which theme is being used?
A. Movement
B. Place
C. Region
D. Relative location
35. Farmers divert water for irrigation, changing a lake and affecting nearby fishing communities. This is an example of
A. human–environment interaction
B. absolute location
C. a formal region
D. a reference map
36. A student says, “This coastal town has fishing docks, a humid climate, beaches, and a local seafood culture.” The student is mainly describing
A. place
B. movement
C. a cartogram
D. absolute direction
37. People commuting daily from suburbs to downtown jobs best demonstrates
A. movement
B. latitude
C. perceptual region
D. a map projection
38. A neighborhood’s emotional meaning to residents, such as feeling “like home,” is called
A. sense of place
B. absolute distance
C. spatial distortion
D. remote sensing
Regions, people, and environment
39. An area united by a shared characteristic, such as a common language or climate, is a
A. formal region
B. functional region
C. perceptual region
D. random distribution
40. The delivery area served by one pizza restaurant is a
A. formal region
B. functional region
C. perceptual region
D. physical region only
41. The “American South” or “Middle East” can have debated boundaries because it is often a
A. functional region
B. formal region
C. perceptual region
D. political map
42. A functional region is organized around
A. a central node or focal point
B. a shared language only
C. a perfectly agreed-on identity
D. latitude lines
43. Environmental determinism argues that
A. the environment strongly determines how societies develop
B. humans have many possible choices in responding to their environment
C. maps determine political boundaries
D. all resources are renewable
44. Possibilism emphasizes that
A. people can adapt to and modify environmental conditions, especially using technology
B. climate completely controls culture
C. every environmental change is beneficial
D. natural resources never run out
45. Which is a renewable resource?
A. Coal
B. Petroleum
C. Solar energy
D. Natural gas
46. Sustainability means using resources in ways that
A. meet present needs while considering future generations
B. use nonrenewable resources as quickly as possible
C. prevent all human use of the environment
D. eliminate every city and road
47. Roads, apartment buildings, factories, and shopping centers are all part of the
A. built environment
B. Prime Meridian
C. natural environment only
D. absolute location
48. The visible imprint of a culture on the landscape, including architecture and land use, is called the
A. cultural landscape
B. relative location
C. cartogram
D. dispersal pattern
Scale, interaction, and synthesis
49. The idea that interaction between places generally becomes weaker as the distance between them increases is
A. distance decay
B. time-space compression
C. absolute direction
D. possibilism
50. New high-speed transportation reduces the travel time between two cities even though their physical distance stays the same. This is
A. time-space compression
B. distance decay
C. environmental determinism
D. a perceptual region
Answer key and correction guide (about 12–15 minutes)
Score one point per correct answer. Then read the explanation only for the questions you missed or guessed on. Circle topics with two or more misses; those are the topics to review once more before the test.
| # | Answer | Why |
|---|---|---|
| 1 | B | Spatial patterns describe where features and phenomena are located and arranged across Earth. |
| 2 | A | A ratio scale compares the same unit on the map and in real life. |
| 3 | C | Large-scale maps cover less area but show more detail. |
| 4 | B | A compass rose identifies direction, usually cardinal and sometimes intermediate directions. |
| 5 | A | Reference maps show where physical or human features are located. |
| 6 | A | Choropleth maps use color shading to show values by area. |
| 7 | A | Dot-distribution maps use dots to show the amount or location of a phenomenon. |
| 8 | B | Graduated-symbol maps change symbol size to represent different values. |
| 9 | A | Isoline maps use lines joining places with equal values, such as pressure or elevation. |
| 10 | A | Cartograms resize areas to represent a statistic such as population. |
| 11 | B | Flattening a spherical Earth always changes some combination of area, shape, distance, or direction. |
| 12 | A | Mercator preserves direction well for navigation but exaggerates areas near the poles. |
| 13 | B | The Peters projection seeks to preserve relative area, while distorting shapes. |
| 14 | A | Robinson is a compromise projection that balances several kinds of distortion. |
| 15 | A | Clustered features are concentrated close to one another. |
| 16 | B | Dispersed features are spread apart over a larger area. |
| 17 | B | A linear pattern follows a line, such as a road, river, or rail route. |
| 18 | B | Closely spaced contour lines mean elevation changes rapidly, producing a steep slope. |
| 19 | B | Coordinates identify one exact position: absolute location. |
| 20 | B | Relative location explains where a place is compared with another place. |
| 21 | A | Latitude lines circle Earth parallel to the Equator. |
| 22 | B | Longitude measures east and west of the Prime Meridian. |
| 23 | D | South of the Equator is Southern; east of the Prime Meridian is Eastern. |
| 24 | B | The Equator separates Northern and Southern Hemispheres. |
| 25 | B | The Prime Meridian is longitude. |
| 26 | A | GPS uses satellites to help identify location and guide navigation. |
| 27 | A | GIS layers and analyzes geographic data to answer location-based questions. |
| 28 | A | Remote sensing gathers information from a distance, often using satellites or aircraft. |
| 29 | B | A numerical count is quantitative data. |
| 30 | B | A description of residents’ views or experiences is qualitative data. |
| 31 | B | Movement includes the flow of goods, people, and ideas among places. |
| 32 | A | Place is defined by a location’s physical and human characteristics. |
| 33 | B | Coordinates describe the theme of location, specifically absolute location. |
| 34 | C | A region is an area grouped by a shared trait or pattern. |
| 35 | A | The example shows people changing nature and experiencing environmental consequences. |
| 36 | A | Climate, physical features, and culture together describe place. |
| 37 | A | Commuting is the movement of people between places. |
| 38 | A | Sense of place is the meaning, attachment, or feeling people associate with a location. |
| 39 | A | Formal regions are defined by a shared, measurable characteristic. |
| 40 | B | A functional region is organized around a node and the activity connected to it. |
| 41 | C | Perceptual regions exist mainly through shared beliefs and often have fuzzy boundaries. |
| 42 | A | A node, such as a downtown, airport, or store, organizes a functional region. |
| 43 | A | Environmental determinism claims the physical environment determines social and cultural development. |
| 44 | A | Possibilism argues that environments provide limits and opportunities, but people make choices. |
| 45 | C | Solar energy can be renewed naturally; fossil fuels are finite. |
| 46 | A | Sustainability considers long-term environmental and human needs. |
| 47 | A | The built environment consists of human-made structures and infrastructure. |
| 48 | A | A cultural landscape is the visible result of people and cultures shaping their surroundings. |
| 49 | A | Distance decay means interaction tends to decline as distance increases. |
| 50 | A | Time-space compression occurs when improved transportation or communication makes places feel closer in time or cost. |
Accuracy and wording flags to remember
These are useful if your study guide uses simplified wording.
-
“Latitude is horizontal; longitude is vertical.” This is a useful map-reading shortcut, but not perfectly literal. Latitude circles run east–west; longitude lines connect the poles and converge there.
-
Scale ratios require matching units. A scale of means one map unit equals 1,000 of the same real-world units. It does not automatically mean one inch equals 1,000 miles.
-
GPS satellite numbers may be oversimplified. Introductory explanations often mention 24 satellites, which is the historic minimum constellation concept. The actual operational system can include more satellites.
-
“The Middle East,” “the South,” and similar regions are often perceptual. Their borders can vary depending on who is defining them and why.
-
Environmental determinism is not accepted as a complete explanation of culture. It has a history of being used to justify racist and colonial claims. For test questions, recognize it as the view that environment determines culture; contrast it with possibilism.
The highest-priority items to retain are these: distinguish absolute from relative location, identify the five themes from an example, remember that large scale means more detail, and separate formal, functional, and perceptual regions. For a final five-minute review, revisit only the questions you missed and say aloud why the correct answer fits better than the other choices.
Can't find a good explanation? Sign up and we'll make it for you
Sign up