
Welcome. This first module builds the vocabulary that makes every later statistics question easier: what group we care about, what part of it we observed, and which numbers describe each. If these four terms have been blending together, focus on their roles rather than trying to memorize four separate definitions.
By the end of this lesson, you should be able to read a study description and identify its population, sample, parameter, and statistic. This is the starting point for deciding whether a study’s conclusion applies to the people or objects it claims to describe.
The basic story: learn about a whole group from part of it
Statistics often begins with a practical problem: we want information about a large group, but measuring every member would take too much time, money, or effort. So we measure a smaller group and use what we learn as evidence about the larger group.
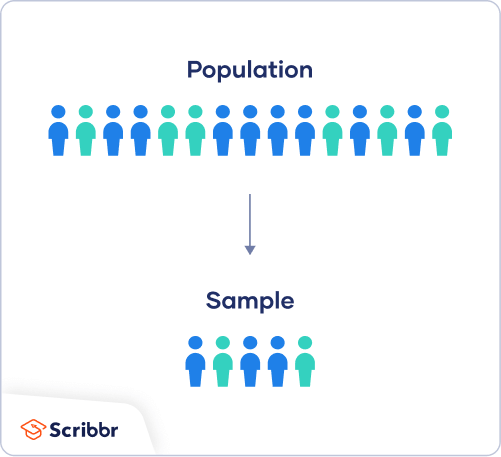
The four terms split into two kinds:
| What it is | Refers to the whole target group | Refers to the observed subset |
|---|---|---|
| A group of people, objects, or records | Population | Sample |
| A numerical summary | Parameter | Statistic |
The crucial pairing is:
- A parameter describes a population.
- A statistic describes a sample.
A statistic is usually calculated because the parameter is unknown. The statistic is our best available estimate of the parameter, provided the sample was collected well.
Statistic vs Parameter & Population vs Sample
Watch “Statistic vs Parameter & Population vs Sample” by The Organic Chemistry Tutor for a compact visual introduction to the four terms and the symbols used for common numerical summaries.
Watch the core walkthrough. First notice the distinction between the entire group and a subset, then pay particular attention to the town-age example: the same type of number, an average age, is a parameter or a statistic solely because of which group it summarizes. The final portion introduces symbols; recognize them, but do not worry about memorizing every one yet.
Define the four terms precisely
Population
The population is the entire group that the researcher wants to understand. It is determined by the research question, not merely by the number of people who happened to respond.
For example:
A college wants to estimate the average number of hours first-year students study per week during the fall term.
The population is all first-year students at that college during that fall term.
Notice the boundaries: which college, which students, and what time period. Leaving out those details often makes an answer too broad.
Sample
The sample is the subset of the population from which data were actually collected.
If the college randomly selects and surveys 80 first-year students, the sample is the 80 selected students. You may also describe it as the 80 students’ recorded study-hour values, depending on how the question is phrased.
A sample does not automatically have to be random to be a sample. “Random” describes how it was selected. Later, you will examine whether a sampling method is likely to give a representative sample.
Parameter
A parameter is a number describing the entire population.
In the study-hours example, the parameter is:
the true mean number of study hours per week for all first-year students at the college in the fall term.
Researchers usually do not know this value, which is exactly why they collect a sample.
Two common parameters are:
A mean summarizes a numerical measurement, such as study hours or GPA. A proportion summarizes a yes-or-no or category-based outcome, such as the proportion who own a car or favor a policy.
Statistic
A statistic is a number calculated from the sample.
Suppose the 80 surveyed students report a mean of 11.8 study hours per week. Then 11.8 hours is the statistic. It estimates the population parameter, the true mean study hours for all first-year students.
Common sample statistics are:
The bar in and the hat in are reminders that these values came from a sample.
Read the “Key Terms” discussion from OpenStax to reinforce the population/sample and parameter/statistic pairings before applying them to study descriptions.
In the “Key Terms” section, read from the sampling explanation. Focus on the sentence that says a statistic represents a property of a sample and the following sentence that defines a parameter as a numerical characteristic of the whole population. The final paragraph’s distinction between numerical and categorical variables is only a preview for the next lesson.
A reliable method for study descriptions
When a question gives you a paragraph, do not hunt immediately for numbers. First identify the scope of the study.
Use this five-step routine:
- Find the research goal. Ask: “About whom or what does the researcher want a conclusion?”
- State the population. Begin with “all” and include important boundaries such as location, date, or eligibility.
- Locate who was actually measured. Words such as “surveyed,” “selected,” “sampled,” and “observed” usually identify the sample.
- Identify the population summary. This is the parameter: the intended mean, proportion, median, or other number for all members of the population.
- Identify the sample summary. This is the statistic: the calculated number based on the sampled members.
A useful answer frame is:
Population: all [target group].
Sample: the [number] [members] who were measured.
Parameter: the [mean/proportion/etc.] for all members of the target group.
Statistic: the [reported or calculated mean/proportion/etc.] for the sampled members.
The words all and sampled do a great deal of work in these answers.
Worked example: a mean
Consider this study:
A city transit department wants to estimate the mean commute time of all full-time workers who live in the city. It randomly surveys 250 full-time city residents and finds a mean commute time of 31.4 minutes.
Work from the target outward.
- Population: all full-time workers who live in the city.
- Sample: the 250 full-time city residents surveyed, assuming they meet the stated worker criterion.
- Parameter: the true mean commute time of all full-time workers who live in the city.
- Statistic: the sample mean commute time, 31.4 minutes.
The number 31.4 is not the sample itself. It is a summary calculated from the sample, so it is a statistic.
Also notice that the population is not “31.4 minutes,” and it is not “all commute times” with no further description. A population is the group of units; its parameter is the numerical feature of that group.
Worked example: a proportion
Now consider a category-based question:
A public library wants to estimate the proportion of adult residents in its service area who support Sunday hours. From a random sample of 500 adult residents, 335 say they support Sunday hours.
Here the outcome is whether someone supports Sunday hours.
- Population: all adult residents in the library’s service area.
- Sample: the 500 adult residents selected.
- Parameter: the true proportion of all adult residents in the service area who support Sunday hours.
- Statistic: the sample proportion who support Sunday hours.
The sample proportion is:
So the statistic can be stated as 0.67, or 67 percent.
The value 335 is a count from the sample. In many introductory questions, the expected statistic is the proportion 0.67 because the study aims to estimate a proportion. Technically, a sample count is also a numerical summary, but matching the statistic to the stated research goal is the clearest approach.
The most common mix-ups
Mixing up group and number
Population and sample are groups. Parameter and statistic are numbers.
- “All eligible voters in the province” is a population.
- “1,200 surveyed eligible voters” is a sample.
- “The proportion of all eligible voters who plan to vote” is a parameter.
- “The proportion of the 1,200 surveyed voters who plan to vote” is a statistic.
Assuming every number is the statistic
A study description may include a population size, such as “the university has 18,000 students.” The number 18,000 tells you the size of the population; it is not necessarily the parameter being studied.
Ask: Does this number summarize the outcome of interest for the sample? If yes, it is likely the statistic.
Choosing a population that is too broad
If researchers sampled 300 customers at one branch during March, the population is not automatically “all customers everywhere.” The intended target might be all customers at that branch during March, all customers of that company, or something else. Let the research question establish the target.
Thinking a parameter must be unknown
Parameters are often unknown, but “unknown” is not their definition. A parameter is simply a numerical summary of the full population. If a true census is available, the population parameter can be calculated exactly.
A final compact example
A phone manufacturer tests 60 batteries from that day’s production. The batteries last an average of 19.6 hours. The manufacturer wants to know the mean battery life of all batteries produced that day.
The structure is now visible:
| Role | Identification |
|---|---|
| Population | All batteries produced that day |
| Sample | The 60 tested batteries |
| Parameter | The true mean battery life of all batteries produced that day |
| Statistic | The tested batteries’ mean lifetime, 19.6 hours |
The phrase “wants to know” points toward the population and parameter. The phrase “tests 60” identifies the sample. The reported average, 19.6 hours, is the statistic.
Takeaways
The four terms form two matched pairs:
- Population: the whole target group.
- Sample: the part actually observed.
- Parameter: a numerical summary of the population.
- Statistic: a numerical summary of the sample, commonly used to estimate the parameter.
When reading a study, first identify the target group, then the measured group, and only then classify the numerical summaries. This prevents nearly all of the usual confusion.
Next, you will classify the measurement collected from each member of a population or sample, distinguishing categorical variables from quantitative variables and separating discrete from continuous quantitative data.
Can't find a good explanation? Sign up and we'll make it for you
Sign up