
Hello again. In the previous lesson, you separated the groups in a study (population and sample) from the numerical summaries of those groups (parameter and statistic). Now we turn to the information recorded for each person or object in those groups: the variables.
By the end of this lesson, you should be able to classify a variable as categorical or quantitative. When it is quantitative, you will also decide whether it is discrete or continuous. This is an early but important choice: it affects which graphs, summaries, and statistical methods make sense later.
A variable is what is recorded about each observational unit
A variable is a characteristic that can vary from one individual, object, or record to another.
If a college surveys students, each student is an observational unit. The survey might record variables such as:
- major
- number of courses taken
- commuting distance
- whether the student has a part-time job
- height
Each variable asks one specific question about every unit. The data are the recorded answers.
The first classification question is not “Does the data entry contain digits?” Instead ask:
Is the value a label for a group, or does it represent an amount for which arithmetic is meaningful?
That separates categorical from quantitative variables.
Categorical variables: labels that place units into groups
A categorical variable records a label, category, or group membership. It is also called a qualitative variable.
Examples include:
| Variable | Possible values | Why it is categorical |
|---|---|---|
| Eye colour | brown, green, blue | Values are labels |
| Program of study | biology, business, history | Values identify groups |
| Has a driver’s licence? | yes, no | Values identify categories |
| Type of phone | Android, iPhone, other | Values identify categories |
It would not make sense to calculate a mean eye colour or add together students’ majors. We can count how many observations fall in each category, but the categories themselves are not quantities.
Numbers can still be category labels
A common trap is assuming that any variable written with numbers is quantitative. Some numbers are simply codes or identifiers.
Consider these:
- Student ID number: categorical. The number identifies a student; student ID 400200 is not “twice as much student” as ID 200100.
- Postal or ZIP code: categorical. It indicates an area, not a measured amount.
- Jersey number: categorical. A player wearing number 20 does not have twice the jersey-number quantity of a player wearing number 10.
- A satisfaction response coded through : categorical for now. The digits stand for response categories such as “strongly disagree” through “strongly agree.” You will examine ordered categories and measurement levels in the next lesson.
A useful test is this: Would calculating an average give an interpretable result? An average postal code or average jersey number does not describe a meaningful amount, so those values are categorical labels.
Quantitative variables: amounts with meaningful arithmetic
A quantitative variable records a numerical amount. It is also called a numerical variable.
Examples:
- height in centimetres
- time spent studying in hours
- number of siblings
- temperature
- number of messages received in a day
With quantitative data, arithmetic operations have meaning. For example, a mean height, a difference in study time, or a total number of messages can all be interpreted sensibly.
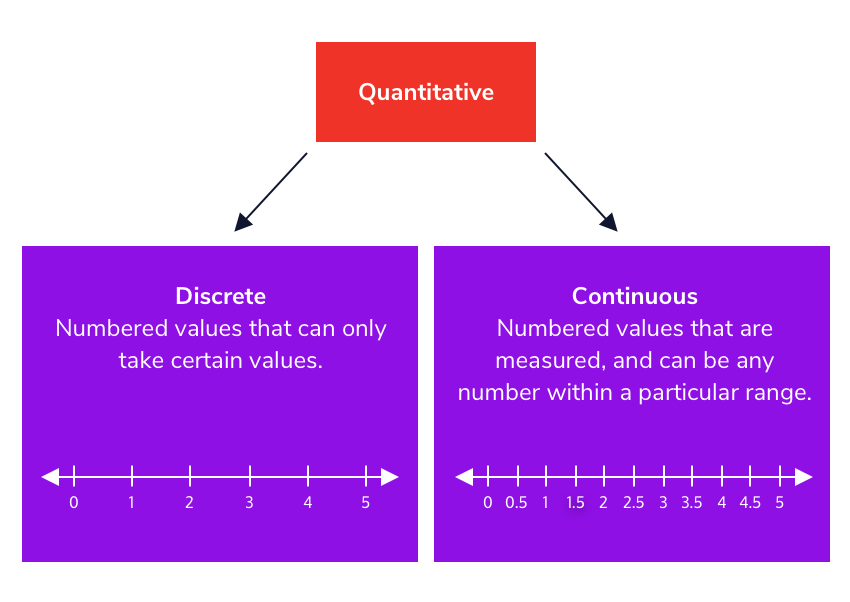
But quantitative variables come in two different forms: discrete and continuous.
Watch Qualitative and Quantitative by The Organic Chemistry Tutor for a compact visual explanation of the whole classification. The key point is that both counted and measured data are quantitative, but their possible values differ.
Watch the core distinction for the definitions and examples of discrete and continuous data. Then watch the classifications to see the method applied to counts, colours, height, and descriptive traits. Pause briefly before each answer and classify it using the decision rule in this lesson.
Discrete quantitative variables: values that are counted
A discrete quantitative variable has separate, distinct possible values. Usually, it comes from counting.
Examples include:
- number of pets in a household
- number of courses taken this term
- number of goals scored
- number of defective items in a shipment
- number of customers entering a store in one hour
If a household has 3 pets, it cannot have 3.6 pets. There may be many possible counts, but there are gaps between them: 3 and 4 are possible, while most values between 3 and 4 are not.
The phrase “discrete means whole numbers” is a helpful first shortcut, but the deeper idea is better:
A variable is discrete when only particular separate values are possible.
For instance, a test score out of 50 is generally discrete because it counts points earned. A score of 42.5 might be possible only if the marking scheme explicitly allows half-points; otherwise, it is not.
Continuous quantitative variables: values that are measured
A continuous quantitative variable can, in principle, take any value in an interval. It usually comes from measuring.
Examples include:
- height
- weight
- distance travelled
- elapsed time
- temperature
- volume of water
A person may be recorded as 172 cm tall, but their exact height could be 172.4 cm, 172.43 cm, and so on. The instrument may round the recorded result, but the underlying height can vary continuously.
Recorded values versus the underlying variable
This distinction prevents a frequent mistake:
Rounding a measurement does not turn a continuous variable into a discrete variable.
Suppose a clinic records every patient’s height to the nearest centimetre: 165 cm, 166 cm, 167 cm, and so on. The recorded dataset contains whole numbers, but height itself is continuous because a person could have any height within the measurement range.
Likewise, a stopwatch that displays only seconds may record 48 seconds or 49 seconds, while the actual elapsed time could have been 48.2 or 48.8 seconds. Time is still continuous.
A dependable classification routine
For each variable, use this sequence.
-
Name what is being recorded.
Do not classify a number merely because it appears in a sentence. Identify the characteristic first. -
Ask whether its values are labels or quantities.
- Labels, types, or groups: categorical
- Numerical amounts for which arithmetic is meaningful: quantitative
-
If quantitative, ask how the value arises.
- Counted separate items or events: discrete
- Measured amount that can vary along a scale: continuous
-
Check an awkward value.
Could a value such as make sense?- “2.5 siblings” or “2.5 cars” does not make sense, so these are discrete counts.
- “2.5 hours” or “2.5 km” makes sense, so these are continuous measurements.
The “could it be fractional?” check is useful, but always use the meaning of the variable, not just the way a dataset happened to be written.
Work through realistic examples
Example 1: A streaming-service survey
A streaming service asks 500 subscribers about their weekly use.
| Recorded variable | Classification | Reasoning |
|---|---|---|
| Primary device used | Categorical | Phone, TV, tablet, and laptop are labels for device types. |
| Number of profiles on the account | Quantitative, discrete | This is a count of profiles. |
| Hours watched last week | Quantitative, continuous | Time is measured and can include partial hours. |
| Subscription plan code | Categorical | Even if plans are coded 1, 2, and 3, the digits are labels. |
Notice that the same study can contain all three types. Classify each variable, not the study as a whole.
Example 2: “Age” needs context
Age can look confusing because it may be reported in several forms.
- Exact age, such as 19.42 years: quantitative, continuous.
- Age in completed years, such as 19 years old: often treated as quantitative and discrete in the recorded data because only whole-year values are recorded.
- Age group, such as under 18, 18–24, 25–34: categorical, because the variable records a group rather than the exact amount.
The wording tells you what was actually collected. “Age” alone is not always enough.
Example 3: A class dataset
Suppose an instructor records these variables for each student:
- section number
- commute distance in kilometres
- number of missed classes
- final letter grade
Their classifications are:
- Section number: categorical. It is an identifying label for a class section.
- Commute distance: quantitative, continuous. It is a measurement.
- Number of missed classes: quantitative, discrete. It is a count.
- Final letter grade: categorical. A letter grade is a category, even though it represents a level of performance.
A variable’s name can mislead. “Section number” includes the word “number,” but its role is categorization, not measurement.
The classification map
Keep this structure in mind:
| First decision | Result | Second decision, if needed |
|---|---|---|
| Is the value a label or group? | Categorical | No discrete/continuous decision is needed |
| Is the value a meaningful numerical amount? | Quantitative | Decide whether it is discrete or continuous |
| Is it counted in separate units? | Quantitative | Discrete |
| Is it measured on a scale? | Quantitative | Continuous |
The main relationships are:
- Categorical variables describe which kind.
- Quantitative variables describe how many or how much.
- Discrete quantitative variables are usually counts.
- Continuous quantitative variables are usually measurements.
Avoid these three errors
1. “It has digits, so it must be quantitative.”
Not necessarily. Identification numbers, postal codes, and category codes use digits as labels. Ask whether arithmetic on the values would mean anything.
2. “It was written as a whole number, so it must be discrete.”
Not necessarily. A value such as 70 kg may have been rounded to the nearest kilogram. Weight remains a continuous measurement.
3. “If it can be put into groups, it is categorical.”
Any quantitative variable can be grouped later. For example, exact incomes can be placed into “low,” “middle,” and “high” income groups. But income measured in dollars is quantitative; income group is categorical. Classify the form in which the variable was recorded.
Takeaways
A variable is a characteristic recorded for each observational unit.
- Categorical (qualitative): values are labels or group memberships, such as eye colour or program of study.
- Quantitative (numerical): values represent amounts for which arithmetic is meaningful.
- Discrete quantitative: separate possible values, usually produced by counting, such as number of siblings.
- Continuous quantitative: values measured on a scale, with any intermediate value possible in principle, such as height or time.
When you are unsure, first ask whether the number represents an amount or merely a label. If it is an amount, determine whether it was fundamentally counted or measured.
Next, you will go one layer deeper with variables by identifying their level of measurement: nominal, ordinal, interval, or ratio.
Can't find a good explanation? Sign up and we'll make it for you
Sign up