
Hello again. In the previous lesson, you separated positive statements—testable claims—from normative statements, which contain value judgements about what ought to happen. We now turn to the basic model that explains why those policy choices are unavoidable: resources are limited, while the possible uses of those resources are numerous.
This lesson builds your ability to read and draw a production possibility frontier (PPF). By the end, you should be able to use it to explain scarcity, choice, opportunity cost, productive efficiency, and economic growth in an Edexcel-style answer.
The central idea: an economy has limits
A production possibility frontier (PPF) shows the maximum attainable combinations of two goods or services that an economy can produce when it uses its available resources and technology efficiently.
Economists use only two outputs on a PPF diagram, such as:
- consumer goods and capital goods;
- pizzas and sugar;
- healthcare and education.
This is a simplification. Real economies produce millions of products, but the model makes a crucial point clear: an economy has finite factors of production—land, labour, capital and enterprise. It cannot produce unlimited amounts of everything.
That constraint is scarcity.
For example, if workers, factories, materials and land are being used to produce more consumer goods, fewer resources may be available to produce capital goods. The PPF therefore turns the abstract idea of scarcity into a visible trade-off.
Watch the following video once through for the overview. It uses the PPF in exactly the way Edexcel expects: as a diagram for constraints, trade-offs, efficiency, and changes in productive capacity.
Y1 2) Production Possibility Curves - PPCs / PPFs
“Y1 2) Production Possibility Curves - PPCs / PPFs” by EconplusDal gives a clear visual foundation before you practise interpreting the diagram yourself.
Watch the PPF purpose for scarcity and choice. Then watch opportunity cost, concentrating on why the curve is usually bowed outward. Continue with efficiency to distinguish points on, inside, and outside the frontier. Finish with PPF shifts, which explains reallocation of resources and economic growth.
Reading the three zones of a PPF
A PPF has two axes. Each axis measures output of one good. The line or curve marks the economy’s production limit at that time, given its current resources and technology.
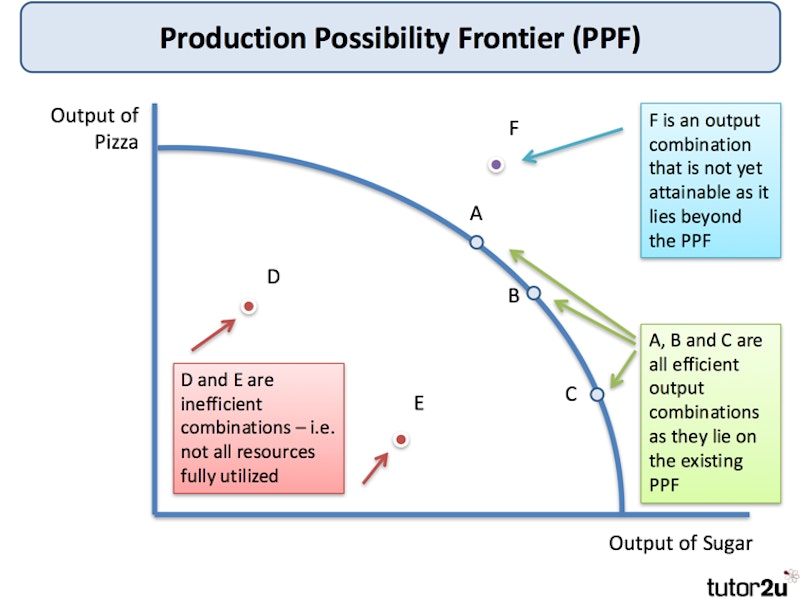
There are three possible positions.
| Position | Meaning | Likely explanation |
|---|---|---|
| On the PPF | Productively efficient and attainable | Resources are fully and efficiently employed. |
| Inside the PPF | Attainable but productively inefficient | Some resources are unemployed, underused, or used wastefully. |
| Outside the PPF | Currently unattainable | The economy lacks sufficient resources, productivity, or technology. |
Points on the PPF: productive efficiency
Any point on the frontier is productively efficient. This means that, using existing resources and technology, the economy cannot produce more of one good without producing less of the other.
For instance, at point B in the diagram, the economy is making a particular quantity of pizza and sugar. To obtain extra sugar while staying within its current productive capacity, it must divert some resources away from pizza. Pizza output will fall.
A useful exam definition is:
Productive efficiency occurs when it is impossible to increase the output of one good without reducing the output of another good, given available resources and technology.
Do not say that only one point on the curve is productively efficient. Every point on the PPF is productively efficient. The economy may still debate which combination is best for society; that question concerns allocative efficiency, which cannot be determined merely by seeing that a point lies on a PPF.
Points inside the PPF: unused potential
A point such as D or E lies inside the PPF. It is attainable, but it shows productive inefficiency because the economy could produce more of both goods without any new resources.
This could occur because of:
- unemployment of labour;
- factories or machinery left idle;
- poor management;
- workers lacking relevant skills;
- resources allocated wastefully;
- a recession, which reduces demand and leaves spare capacity.
An economy inside its PPF does not need to sacrifice one good to produce more of the other. It can initially expand output of both by making better use of resources.
Points outside the PPF: a current limit, not an impossibility forever
A point outside the frontier is not currently attainable. It is not necessarily a foolish target: it may become feasible after an improvement in technology, skills, infrastructure, or the quantity of resources available.
A common exam mistake is to call an outside point “inefficient.” It is more accurate to say it is unattainable at present. Inefficiency refers to a point inside the frontier.
Scarcity creates choice, and choice creates opportunity cost
Because resources are scarce, societies must make choices about what to produce. A point on the PPF represents one such choice.
Suppose an economy can make consumer goods, such as meals and clothing, or capital goods, such as machinery, factories and equipment. If it decides to produce more capital goods, it has to give up some consumer goods. The value of the best alternative forgone is the opportunity cost.
Opportunity cost is the value of the next best alternative that is forgone when a choice is made.
On a PPF, opportunity cost is shown by a movement along the curve.
Consider this simplified data:
| Output combination | Consumer goods | Capital goods |
|---|---|---|
| A | 20 | 90 |
| B | 50 | 70 |
When the economy changes from A to B:
- consumer-goods output rises by ;
- capital-goods output falls by .
Therefore, the opportunity cost of producing the additional consumer goods is 20 capital goods.
Per additional consumer good, the opportunity cost is:
The units matter. Always state opportunity cost in terms of what is sacrificed, not merely as a number.
Why is a PPF usually curved?
Most PPFs are bowed outward from the origin. This shows increasing opportunity cost.
Resources are not equally suitable for every purpose. A worker trained in engineering may be especially productive in machinery production, while fertile farmland may be particularly suited to food production. At first, an economy can transfer resources that are reasonably adaptable. But as it increasingly specialises in one good, it has to shift resources that are progressively less suitable.
As a result, each additional unit of the chosen good requires a bigger sacrifice of the other good.
For example:
- moving from low to moderate car production may require giving up relatively little food output;
- moving from already high to even higher car production may require transferring agricultural land and workers that are much less suitable for car production;
- the loss of food output becomes greater.
A straight-line PPF is a special case. It shows constant opportunity cost: each extra unit of one good always costs the same amount of the other. For A-level analysis, focus first on the usual curved PPF and the idea of increasing opportunity cost.
Use these short Seneca sections as a compact written recap. They reinforce the distinction between movement along the curve, productive efficiency, and changes in the position of the whole curve.
Economics: Edexcel A A Level - Production Possibility Frontiers
Read these Seneca Learning notes to consolidate the exact PPF language needed for Edexcel diagrams and written explanations.
In the subsection “PPF and economic growth,” read the growth explanation, noting that technological progress may affect one output more than another. Then, in “PPF and trade-offs,” read the trade-off section and connect each trade-off to opportunity cost. Next, in “PPF and productive efficiency,” read the three positions. Finally, in the “Capital vs consumer goods” subsection under “Shifting the Production Possibility Frontier,” read capital and consumer goods to see why present choices can affect future productive potential.
Economic growth: moving the PPF outward
The PPF can shift if the economy’s productive capacity changes.
An outward shift means the economy can potentially produce more of both goods than before. It represents an increase in productive potential, commonly called long-run economic growth.
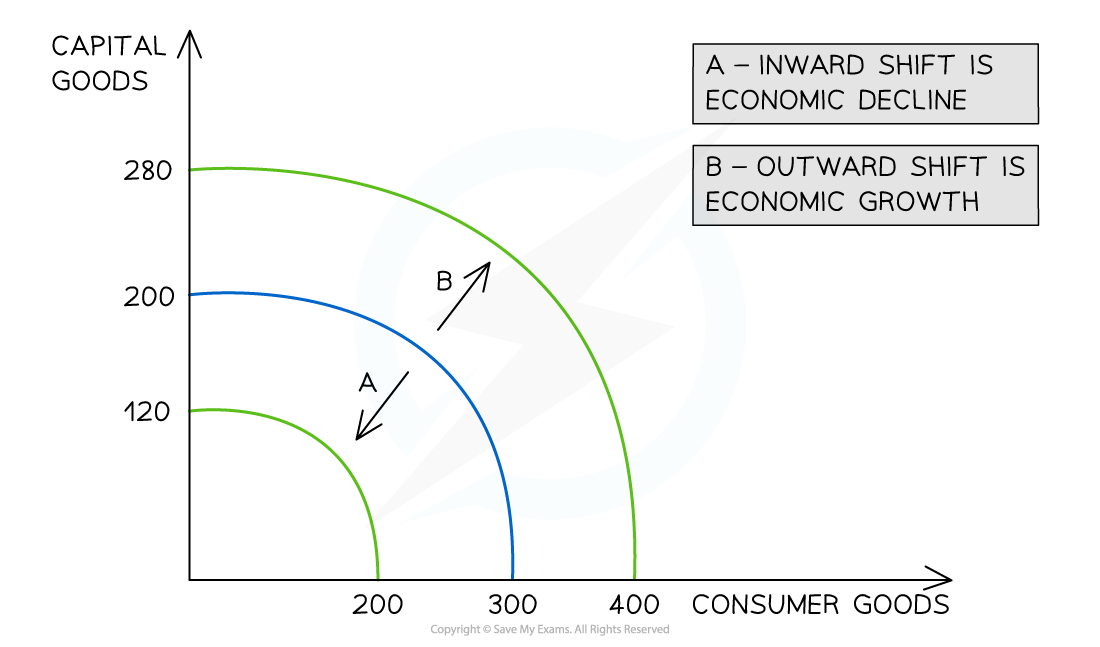
An outward shift may be caused by:
- investment in capital goods, such as machinery, roads, broadband or factories;
- a larger or better-skilled labour force;
- improved education and training, increasing human capital;
- technological innovation;
- more effective management and organisation;
- discovery or improved use of natural resources.
A strong analytical chain might be:
Investment in new machinery increases the economy’s capital stock. Workers can produce more output per hour, raising labour productivity. The economy’s productive capacity rises, so the PPF shifts outward. It can now potentially produce more consumer and capital goods.
This is better than simply writing “investment causes growth.” You have shown the mechanism.
The consumer-goods versus capital-goods trade-off
Capital goods are not usually bought for immediate consumption. They are used to produce other goods and services in the future. This creates an important intertemporal choice.
If an economy chooses more consumer goods now, households may enjoy a higher current standard of living. However, if it devotes more resources to capital goods, it sacrifices some consumption today but may achieve greater productive capacity in the future.
This does not mean every investment project automatically creates growth. Its success depends on whether the investment is productive, well managed, and supported by suitable skills and demand. But the PPF is useful for showing the underlying trade-off.
An inward shift: falling productive potential
A PPF can also shift inward, meaning that the economy can produce less than before. This is sometimes described as negative economic growth or economic decline.
Possible causes include:
- destruction of infrastructure or capital by war, earthquakes, floods, or other disasters;
- depletion of natural resources;
- emigration of skilled workers, sometimes called a brain drain;
- long-term loss of skills during unemployment;
- deterioration of machinery, infrastructure, or public services;
- lower productivity.
Do not confuse a movement with a shift
This distinction is fundamental:
| Change shown | What it means |
|---|---|
| Movement along the PPF | Resources are reallocated between the two goods. Productive capacity is unchanged. |
| Movement from inside the PPF towards it | Existing resources are used more fully or efficiently. This may occur during recovery from recession. |
| Outward shift of the PPF | Productive capacity increases: long-run economic growth. |
| Inward shift of the PPF | Productive capacity falls. |
If unemployment falls and idle factories reopen, actual output can rise as the economy moves towards its existing PPF. That differs from an outward shift, which requires a rise in the amount or productivity of the economy’s resources.
Drawing and using a PPF in an exam
A PPF is valuable only if you explain it accurately. For a diagram question:
- Draw and label two axes with the two outputs.
- Draw a downward-sloping, bowed-out PPF.
- Label points clearly: one on the curve, one inside, or one outside if relevant.
- For economic growth, draw a second PPF further outward and label it , with the original labelled .
- Refer directly to the diagram in your written analysis.
Avoid adding demand-and-supply labels, prices, or equilibrium points. A PPF shows productive capacity and trade-offs, not a market price.
Model explanation: opportunity cost
A movement along the PPF shows opportunity cost. Since resources are finite, producing more capital goods requires resources to be diverted away from consumer goods. Therefore, consumer-goods output must fall. The lost consumer goods are the opportunity cost of the additional capital goods.
Model explanation: productive inefficiency
Point X lies inside the PPF, so it is attainable but productively inefficient. This may be caused by unemployment and unused capital. The economy could increase production of both goods by using its existing resources more fully, without having to give up output of either good.
Model explanation: economic growth
An outward shift of the PPF shows an increase in productive capacity. For example, investment in new technology may raise productivity, allowing a greater quantity of output to be produced from the same resources. Consequently, the economy can produce more consumer and capital goods than previously.
For higher-mark responses, be precise about the condition behind your claim. For example, investment increases productive potential only if the machinery is effectively used and workers have suitable skills. This kind of conditional reasoning adds evaluation without losing the main explanation.
Key takeaways
- A PPF shows the maximum combinations of two goods an economy can produce with available resources and technology.
- Scarcity means resources are finite; therefore, society must make choices.
- A movement along the PPF involves opportunity cost: more of one good means less of the other.
- Points on the PPF are productively efficient; points inside are inefficient; points outside are currently unattainable.
- A bowed-out PPF usually shows increasing opportunity cost, because resources are not equally suitable for all production.
- An outward shift represents higher productive capacity and long-run economic growth. A movement from inside the curve towards it represents fuller use of existing capacity, not necessarily growth in potential output.
- In written answers, state the diagram’s meaning, explain the economic mechanism, and use precise terms such as productive capacity, reallocation, and opportunity cost.
Next, you will examine specialisation and the division of labour—the ways workers and firms can raise productivity, reduce unit costs, and become more economically interdependent.
Can't find a good explanation? Sign up and we'll make it for you
Sign up