
Hello! Welcome to the first lesson in our course on the economic and social drivers of the Venezuelan crisis.
Introduction
Today, we will begin our journey by exploring a fundamental economic concept that is crucial for understanding Venezuela's modern history: Dutch Disease. This phenomenon explains a paradox where a country's sudden wealth from a natural resource can, counterintuitively, undermine its broader economy.
This lesson directly addresses the first learning outcome of our course: Define 'Dutch Disease' and illustrate its mechanisms using a simplified diagram of a national economy with and without a booming natural resource sector.
By the end of this lesson, you will have a solid grasp of this theory, which will serve as the economic foundation for our analysis of pre-Chávez Venezuela in the lessons to come. Your background in economics and policy analysis will be a great asset here, as we'll be connecting economic theory to real-world policy challenges.
Estimated time to complete: 60 minutes.
1. The Paradox of Plenty
It seems logical that discovering vast natural resources should make a country wealthy and prosperous. However, history often shows a different, more complex picture. Many resource-rich nations have experienced slower economic growth, more corruption, and greater inequality than countries with few natural resources. This is often called the "Paradox of Plenty" or the "Resource Curse."
To start, let's watch a short video that introduces this paradox and sets the stage for our main topic.
As the video highlights, countries like Nigeria, and most importantly for our course, Venezuela, have immense resource wealth but have faced profound economic challenges. The key to understanding why lies in the concept of Dutch Disease.
2. Defining Dutch Disease
The term "Dutch Disease" was coined by The Economist in 1977 to describe what happened to the Netherlands after a large natural gas field was discovered in the 1960s. The new gas wealth led to a decline in the country's manufacturing sector.
To get a formal definition, please read the short introductory section of the following Wikipedia article.
Dutch disease (Definition and Origin)
(Reading time: ~2 minutes)
In essence, Dutch Disease describes the causal relationship between the boom in one sector (typically natural resources) and the decline of others (like manufacturing or agriculture).
This happens because the resource boom triggers a large inflow of foreign currency, which strengthens the nation's currency (an appreciation of the real exchange rate). This makes all other exports from that country more expensive for the rest of the world, while making imports cheaper for domestic consumers. The result is that the country's traditional export sectors, like manufacturing, lose their international competitiveness.
For a concise reinforcement of this definition, watch the first 35 seconds of this video from Marginal Revolution University.
3. The Core Mechanisms: How It Works
To understand Dutch Disease from a policy perspective, we need to go beyond the definition and examine the specific economic mechanisms at play. Economists W. Max Corden and J. Peter Neary developed the classic model, which is essential for our analysis.
Their model divides the economy into three parts:
- The Booming Sector: The natural resource being extracted (e.g., oil).
- The Lagging Tradable Sector: Other sectors that compete on the international market (e.g., manufacturing, agriculture).
- The Non-Tradable Sector: Goods and services sold only domestically (e.g., construction, retail, hairdressing).
The resource boom affects the economy through two primary channels: the Spending Effect and the Resource-Movement Effect.
The IMF's "Back to Basics" series provides an excellent and clear explanation of these two effects. Please read the section titled "The diagnosis."
Dutch Disease: Wealth Managed Unwisely (The Diagnosis: Mechanisms of Dutch Disease)
(Reading time: ~5 minutes)
Let's summarise what you've just read:
-
The Spending Effect: This is the primary channel. The massive inflow of foreign currency from oil sales increases demand for the domestic currency, causing it to appreciate. This rise in the real exchange rate makes the lagging tradable sectors (like agriculture and manufacturing) uncompetitive. Their exports become too expensive for foreigners, and they are crowded out by cheaper imports at home.
-
The Resource-Movement Effect: This is the secondary channel. The booming oil sector is highly profitable and can offer higher wages. This pulls capital and labour away from the lagging sectors (manufacturing/agriculture) and into the booming sector itself, as well as into the non-tradable sector (construction, services) which is experiencing higher demand from newly wealthy citizens.
To see these effects in action, let's return to the first video, which provides clear, real-world examples from Trinidad and Tobago and, crucially, Venezuela.
As the video explains, Venezuela's oil boom in the 20th century led to a strong currency that decimated its agricultural and manufacturing sectors. The economy became almost entirely dependent on oil exports, making it extremely vulnerable to fluctuations in the global oil price—a vulnerability that is central to the crisis we are studying.
4. Illustrating Dutch Disease: A Simplified Diagram
The learning outcome requires us to illustrate these mechanisms. A Production Possibility Frontier (PPF) is a classic economic tool to do this. You may recall from your A-level Economics that a PPF shows the maximum combination of two types of goods an economy can produce with its available resources.
For Dutch Disease, we simplify the economy into two categories: Tradable Goods (manufacturing, agriculture) and Non-Tradable Goods (services, construction).
Now, let's look at a diagram that visualizes the effects we've just discussed.
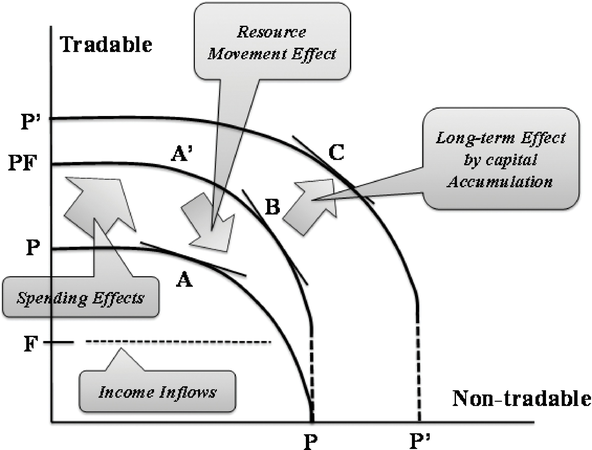
This diagram shows how a resource boom shifts an economy's production. The vertical axis represents 'Tradable Goods' (like manufacturing) and the horizontal axis represents 'Non-tradable Goods' (like services). The curve is the Production Possibility Frontier (PPF).
Let's break down what's happening in this diagram:
- Initial State (Point P): Before the resource boom, the economy produces a certain mix of tradable and non-tradable goods.
- Spending Effect (Move from P to P'): The influx of oil money increases national income. People spend this new wealth, particularly on non-tradable goods and services (like housing, restaurants, and retail), because the price of tradable goods is set by the world market. This increased demand for non-tradables shifts the production mix along the PPF from P towards P', meaning the economy now produces more non-tradables and fewer tradables.
- Resource-Movement Effect (Move from A to B): Labour and capital are pulled out of the lagging tradable sector (e.g., manufacturing) and into the booming oil sector and the expanding non-tradable sector. This "hollowing out" of the manufacturing/agricultural sector reduces its total productive capacity. The diagram shows this as a contraction of the maximum possible output of tradable goods, from point A down to point B.
The combined result is a structural shift in the economy away from diverse tradable sectors like manufacturing and agriculture, and towards a reliance on the single booming resource and the domestic non-tradable sector.
5. A Policy Question: Is It Really a 'Disease'?
Your work in the civil service involves critically assessing situations and avoiding simplistic labels. So, it's fair to ask: is having a hyper-successful export sector truly a "disease"?
Watch this segment of the Marginal Revolution University video, which explores this exact question.
As the video suggests, the "disease" framing is a matter of perspective:
- On one hand, it can be seen as a natural and efficient adaptation. The economy is simply reallocating its resources to what is most profitable.
- On the other hand, and this is the view most relevant to understanding crises, it is a significant problem. It leads to:
- Lack of Diversification: The economy becomes a "one-trick pony," dangerously exposed to the price volatility of a single commodity.
- De-industrialization: The manufacturing sector, often a key driver of innovation and long-term productivity growth ("learning-by-doing"), withers away.
- Vulnerability: When the resource boom ends or prices crash—as they inevitably do—the country has lost its other productive sectors and has nothing to fall back on.
For a country like Venezuela, this lack of diversification and extreme vulnerability to oil prices is not just a theoretical risk; it is the defining feature of its economic trajectory for the last century.
Reflection Activity
Let's apply this to a context closer to home. The UK discovered significant North Sea oil and gas reserves in the late 1960s and 1970s.
Imagine you are a policy advisor in the Department for Business, Energy & Industrial Strategy (BEIS) at that time. Based on what you've learned, write two to three bullet points for a briefing note to your minister outlining the potential risks of the oil boom to the UK's broader economy.
(Take 3-5 minutes to formulate your points.)
Conclusion
In this lesson, we have established a crucial theoretical foundation for our course.
Key Takeaways:
- Dutch Disease describes how a boom in a natural resource sector can lead to a decline in other sectors, particularly manufacturing and agriculture.
- This occurs via two main mechanisms: the Spending Effect (currency appreciation making other exports uncompetitive) and the Resource-Movement Effect (labour and capital being pulled away from other sectors).
- While seemingly a sign of wealth, this phenomenon can be a "disease" because it reduces economic diversification, harms long-term productivity, and leaves a nation highly vulnerable to commodity price shocks.
Preview of the Next Lesson:
We will now move from theory to practice. In our next lesson, we will apply the concept of Dutch Disease directly to pre-Chávez Venezuela. We will analyze a historical chart of oil prices versus Venezuelan GDP and government spending from 1970-1998 to identify the extent of oil dependency, seeing exactly how this "disease" shaped the nation's economy and set the stage for the political turmoil to come.
Can't find a good explanation? Sign up and we'll make it for you
Sign up