
Good to see you again. In the previous lesson, you practised definitions: identifying the precise scientific ideas needed, using the mark allocation as a clue, and avoiding vague wording. A describe question is different. You are not defining a term; you are reporting what is shown, what happens, or how something changes.
In this lesson, you will learn to recognise the different forms of “describe” questions and write answers that contain enough relevant marking points without drifting into unsupported explanations. This is especially useful for data, graphs, practical methods, diagrams, and scientific processes across Biology, Chemistry, and Physics.
What “describe” means in Edexcel
Edexcel’s official meaning is useful because it tells you both what to include and what to leave out: a description is an account in which statements are developed and often linked, but no justification or reason is required.
[PDF] Pearson Edexcel International GCSE in Science (Double Award)
Read the official Pearson wording so that your exam habit matches the command word used in your actual qualification.
In Appendix 5: Command word taxonomy (pp. 77–79), find the row headed “Describe”. Read the full definition. Then briefly compare it with the nearby rows for “Explain” and “Give/State/Name”. Focus on the boundary: description gives linked scientific observations or events; explanation adds reasons.
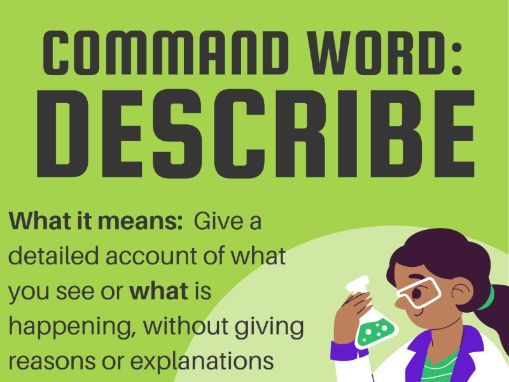
A useful way to remember the command is:
Describe = What happens? What is shown? What changes? In what order?
Explain = Why does it happen? How does it happen?
This does not mean a description must be one-word answers. Edexcel says the points should be developed and often linked. A three-mark description usually needs about three relevant features, stages, comparisons, or observations.
For example, consider this statement:
The volume of gas increases from to , then remains at .
That is a description: it reports a change and a final constant value.
Now compare it with:
The volume stops increasing because all the reactant has been used up.
That is an explanation. It may be scientifically sensible, but if the question says only describe, it is not normally a marking point. More importantly, it may be an unsupported inference if the question gives no evidence that a reactant was used up.
First identify what you are being asked to describe
“Describe” is not one fixed answer format. Before writing, identify the object of the command. Usually it will be one of four types.
| If the question asks you to describe… | Your answer should contain… | Usually avoid… |
|---|---|---|
| A graph, table, or results | trends, changes, values, comparisons, maxima, minima, plateaus | reasons for the trend |
| A process | ordered scientific events | why each event occurs |
| A practical method | apparatus, actions, observations, sequence | long theory paragraphs |
| A difference or feature in a diagram | precise visible or stated features, often paired comparisons | vague labels such as “different shape” |
The noun after “describe” matters as much as the command word itself.
For instance:
-
“Describe the trend shown in the graph.”
Write about the pattern in the data. -
“Describe what happens when sodium reacts with chlorine.”
Write the sequence of particle changes. -
“Describe how a student could demonstrate temporary induced magnetism.”
Write a method and the observations it produces. -
“Describe the difference between transverse and longitudinal waves.”
Write a direct, paired contrast about the same feature.
This quick diagnosis stops you using a graph-answer structure for a method question, or writing a mechanism when the examiner only asked for observations.
Describing data and graphs: turn shapes into scientific statements
Graphs are one of the most common places where students lose “describe” marks. The usual weak answer is:
It goes up and then down.
The problem is not that this is false. It is that it is incomplete. It does not name the variables, show the scale of the change, or identify important features such as a peak or plateau.
A secure graph description connects both variables:
Between and , the gas volume increases from to .
This tells the examiner:
- what changes: gas volume
- the interval over which it changes: to
- the direction: increases
- numerical evidence: to
For a graph or table, use this dependable sequence.
1. State the overall pattern
Look from the beginning to the end. Does the dependent variable generally increase, decrease, stay constant, rise then fall, or fluctuate?
2. Divide the data into meaningful sections
A curve may have several distinct behaviours:
- a steep increase
- a slower increase
- a constant section
- a peak
- a decline
Each clear section can become one developed marking point.
3. Support key statements with figures
Use values and units from the table or graph. If it is a graph, use sensible approximations, such as “about ” rather than pretending the value is exact.
4. Say what stays the same where relevant
A plateau is a feature worth stating:
From to , the volume remains constant at .
“Remains constant” is much stronger than “stops.”
Here is a worked example. Imagine a graph showing gas collected during a reaction.
| Time / s | Volume of gas / |
|---|---|
| 0 | 0 |
| 20 | 24 |
| 40 | 36 |
| 60 | 40 |
| 80 | 40 |
For a three-mark question asking, “Describe the change in volume of gas,” a strong response would be:
The volume increases rapidly from to in the first . It then continues to increase more slowly, reaching at . From to , the volume remains constant at .
Notice that the answer does not add:
This is because the reaction slows down and then finishes.
That would answer an explain question, not a describe question.
The video below gives a compact model of this approach: identify the graph’s sections, state the trend in each, and support the claims with numbers.
IGCSE Biology P4 Tips - Describing graphs
Watch “IGCSE Biology P4 Tips - Describing graphs” from Cambridge In 5 Minutes for a clear demonstration of how a curve can be divided into distinct, markable sections.
Watch the graph model. The graph concerns enzyme activity, but the method applies to any Edexcel science graph: identify the overall trend, separate the curve into its steep, slower, and flat sections, and attach suitable data to each statement. Notice that the response reports observations rather than explaining their cause.
Vocabulary that makes graph descriptions precise
Use verbs that reflect exactly what the data shows:
- increases / decreases
- rises rapidly / rises gradually
- falls steeply / falls gradually
- remains constant
- reaches a maximum / minimum
- levels off
- fluctuates
Only use rapidly, gradually, steeply, or slowly if the gradient genuinely changes. A straight-line increase is simply “increases at a constant rate” if the graph supports that conclusion.
Also be careful with causation. This is descriptive:
As temperature rises from to , the rate increases from to units.
This is explanatory:
The rate increases because particles collide more often.
The first reports a relationship in the data. The second provides a mechanism.
Describing a scientific process: write the observable sequence
When the question says “Describe what happens…” or “Describe how…”, the mark scheme commonly expects an ordered sequence. Think of the process as a short scientific account: first event, next event, resulting observation.
For example, in Chemistry:
Describe what happens when a sodium atom reacts with a chlorine atom.
A suitable description could be:
A sodium atom transfers one electron to a chlorine atom. The sodium atom becomes a positively charged sodium ion, and the chlorine atom becomes a negatively charged chloride ion. Both ions have full outer electron shells.
This reports the sequence and outcome. It does not need to explain the electrostatic attraction between the ions unless the question specifically asks you to explain ionic bonding.
A practical-method description works in the same way. Imagine this Physics prompt:
Describe how a student could use a bar magnet, an iron bar, and paper clips to demonstrate temporary induced magnetism.
A strong three-part answer is:
- Place the iron bar in contact with, or close to, the bar magnet.
- Bring the iron bar near the paper clips and observe that it attracts or picks up the paper clips.
- Remove the bar magnet and observe that the iron bar no longer attracts the paper clips, or that the clips fall off.
The structure is effective because it includes:
- the action that produces the effect
- the observation showing magnetic behaviour
- the observation showing that the behaviour is temporary
It does not need a paragraph about magnetic domains. That would be useful only for an explain question.
For processes, use sequence words where they clarify the order:
- initially
- first
- then
- next
- finally
- after this
Do not add them mechanically to every sentence. They are useful when time order itself is part of the science.
Describing differences: pair the same feature
Some “describe” questions ask for a difference. These can look like compare questions, but you still need a developed statement that refers to both things.
For example:
Describe the difference between transverse and longitudinal waves.
A high-quality answer is:
In a transverse wave, the oscillations are perpendicular to the direction of wave travel. In a longitudinal wave, the oscillations are parallel to the direction of wave travel.
Or, more compactly:
Transverse waves have oscillations perpendicular to the direction of travel, whereas longitudinal waves have oscillations parallel to the direction of travel.
This works because it compares the same feature in both wave types: the direction of oscillation relative to travel.
Avoid unpaired answers such as:
Transverse waves go up and down. Longitudinal waves have compressions.
Both statements may be related to the topic, but they do not clearly state the assessed difference. They use different features, so the examiner has to guess at the comparison you intended.
A helpful rule is:
One feature, both sides.
This matters in Biology too:
Plant cells have a cell wall, chloroplasts, and a permanent vacuole; animal cells do not have these structures.
And in Chemistry:
Ionic compounds conduct electricity when molten or dissolved, whereas solid ionic compounds do not conduct electricity.
You will study the command word compare later. For now, recognise that a “describe the difference” question needs the same paired clarity.
The “no unsupported causes” rule
You are allowed to use scientific vocabulary in a description. The rule is not “write only what a person can see.” The rule is: do not introduce a causal mechanism unless the question asks for it or clearly includes “explain.”
Here is the distinction.
| Question wording | Appropriate answer type |
|---|---|
| “Describe the graph.” | “The rate increases to a maximum, then decreases.” |
| “Explain the graph.” | “The rate increases because…; it decreases because…” |
| “Describe what happens to the bulb.” | “The bulb becomes dimmer and then goes out.” |
| “Explain why the bulb becomes dimmer.” | “The resistance increases, reducing the current…” |
A common mistake is putting because into every science answer. “Because” is not automatically forbidden, but it is a warning sign. Pause and ask:
Am I reporting what the question shows, or am I adding why I think it happens?
If the answer is “why,” save it for an explanation question.
Also avoid conclusions that go beyond the evidence. If a graph shows a population falling, you can write:
The population decreases from about organisms to organisms over five years.
But you cannot safely write:
The population decreases because predators ate the organisms.
Unless the question provides predator data or asks you to suggest or explain a cause, that is speculation.
A fast routine for every “describe” question
Use this routine during topic-question practice and past papers.
1. Circle the thing to describe
Is it a graph, a table, a process, a method, an observation, or a difference?
2. Use the marks to plan the number of points
As a rough guide:
| Marks | Sensible target |
|---|---|
| 1 | One precise feature or observation |
| 2 | Two linked features, stages, or paired differences |
| 3 | Three distinct trend sections, events, or observations |
| 4+ | A complete account with several developed stages or relevant details |
Do not count sentences; count distinct scientific points.
3. Extract only relevant evidence
For graphs, find the turning points, largest change, highest or lowest value, and any plateau. For a process, identify the essential events in order. For a method, identify what is done and what is observed.
4. Write linked statements
Use the structure that matches the question:
- Data: “Between … and …, [dependent variable] increases/decreases from … to …”
- Process: “First … Then … Finally …”
- Difference: “In A … whereas in B …”
- Observation: “The sample/reading/object becomes …”
5. Delete unnecessary causes
Before moving on, scan quickly for a causal addition: “because,” “therefore,” “this is due to,” or a theory paragraph. If the command is only describe, remove it unless it is needed simply to state an event.
Put this into your revision system
For your flashcards, do not make a card that merely says “Describe = say what happens.” Make cards that train the answer structure you need under timed conditions.
| Front of flashcard | Back of flashcard |
|---|---|
| How do I describe a graph? | Name both variables; divide into sections; state direction of change; quote values and units; include peak or plateau; do not explain cause. |
| How do I describe a process? | Give the key events in the correct order. Include scientific names of particles, substances, or structures. |
| How do I describe a difference? | Use one feature and state both sides: “A…, whereas B…”. |
| What must I avoid in a describe answer? | Unsupported reasons, mechanisms, irrelevant knowledge, and vague claims without data. |
Add a separate category to your error log for this command word:
- DS1: gave an explanation instead of a description
- DS2: stated a trend but gave no values
- DS3: named only one variable in a graph answer
- DS4: missed a section, peak, minimum, or plateau
- DS5: described an irrelevant feature
- DS6: gave an unpaired comparison
When you mark a past-paper answer, rewrite it once rather than only reading the mark scheme. For a graph answer, underline every trend word and circle every numerical value. For a process answer, number the events mentally and check that they are in the correct order. This turns the correction into a reusable exam habit.
Key takeaways
- In Edexcel, describe means giving a developed account of relevant features, events, trends, or stages.
- A describe answer should report what happens, what changes, or what is different. It does not normally need reasons.
- For data and graphs, link both variables and support important trends with figures and units.
- For processes and practical methods, give the essential events in a clear sequence.
- For differences, compare the same feature on both sides.
- Use the mark allocation to decide how many distinct points to include, then stop rather than adding unrequested explanation.
Next, you will build on this boundary by learning how to answer “explain” questions with linked cause–mechanism–effect statements.
Can't find a good explanation? Sign up and we'll make it for you
Sign up