
Good to see you again. Last lesson focused on interpreting the result of a crash: whether you have instruction-pointer control, an information leak, or a constrained data-corruption primitive. That evidence is only useful if you can reproduce it cleanly. A reusable pwntools harness gives you one stable interface for running locally, attaching GDB/GEF, collecting exact byte-level traces, and later connecting to the remote service without rewriting the exploit logic.
In this lesson, you will build that harness around one central idea: your exploit code should talk to an abstract pwntools tube, not care whether that tube represents a local process or a network connection.
One exploit interface, several execution modes
Pwntools gives both process() and remote() a very similar interface:
send(),sendline()recv(),recvuntil(),recvline()sendafter(),sendlineafter()interactive()
That similarity matters. If the exploit body is written against io, then switching from your local binary to the challenge server should be a configuration change, not a rewrite.
A well-structured harness separates four responsibilities:
| Part | Responsibility |
|---|---|
| Configuration | Binary path, default host, default port, debugger commands |
| Startup | Decide whether to use a local process, GDB, or a remote socket |
| Exploit logic | Construct payloads and communicate with io |
| Diagnostics | Enable logging, save traffic, tune timeouts, inspect under GDB |
Keep exploit logic out of start(). Conversely, keep hostnames, ports, and debugger setup out of the payload-building code. This prevents a common CTF failure mode: editing several unrelated parts of the script just to switch environments.
pwnlib.args — Magic Command-Line Arguments — pwntools 4.15.0 documentation
Read this official pwntools reference to understand the command-line argument system that makes one script support multiple modes.
In the opening explanation of “pwnlib.args — Magic Command-Line Arguments,” read the local and remote pattern. Then read the complete supported-arguments list under PwnlibArgs, paying particular attention to DEBUG, LOG_FILE, LOG_LEVEL, NOASLR, NOPTRACE, and TIMEOUT. Near the middle of that list, the runtime controls show that pwntools can also adjust behavior without source edits.
A practical convention is:
- Default: run locally.
REMOTE: connect to a TCP service.GDB: launch the local process under GDB.DEBUG: show all sent and received bytes.HOST=valueandPORT=value: override the configured endpoint.
Arguments such as REMOTE, GDB, HOST=..., and PORT=... are available through args. Built-in options such as DEBUG, LOG_FILE, and TIMEOUT also update pwntools’ context automatically.
A reusable baseline harness
Save the following as solve.py in the same directory as your challenge binary. Change BINARY, DEFAULT_HOST, and DEFAULT_PORT for each challenge, but aim to leave the start() function structurally unchanged.
#!/usr/bin/env python3
from pwn import *

# ----- Target configuration -----

BINARY = "./chall"
DEFAULT_HOST = "challenge.example"
DEFAULT_PORT = 31337

exe = context.binary = ELF(BINARY)

# If pwntools cannot open GDB in your preferred terminal layout,
# uncomment and adapt this for your environment:
#
# context.terminal = ["tmux", "splitw", "-h"]

GDBSCRIPT = """
set pagination off
set disassembly-flavor intel
tbreak main
continue
"""


# ----- Connection factory -----

def start(argv=None, **kwargs):
    """Return a tube for local, GDB, or remote execution."""
    argv = [] if argv is None else argv

    if args.REMOTE:
        if args.GDB:
            log.error("GDB mode is intended for the local binary, not a remote TCP service.")

        host = args.HOST or DEFAULT_HOST
        port = int(args.PORT or DEFAULT_PORT)

        log.info(f"Connecting to {host}:{port}")
        return remote(host, port, **kwargs)

    if args.GDB:
        log.info("Launching local target under GDB")
        return gdb.debug(
            [exe.path, *argv],
            gdbscript=GDBSCRIPT,
            **kwargs
        )

    log.info("Launching local target")
    return process([exe.path, *argv], **kwargs)


# ----- Challenge-specific logic -----

def exploit(io):
    """
    Put challenge-specific parsing, payload construction,
    and sends/receives here.
    """

    # Example shape only; replace these for the actual binary:
    #
    # io.sendlineafter(b"Input: ", payload)
    # output = io.recvall(timeout=2)
    # return output

    return None


def main():
    io = start()

    try:
        result = exploit(io)

        if result is not None:
            log.success(f"Received: {result!r}")

        # Add INTERACTIVE when you deliberately want a terminal session.
        if args.INTERACTIVE:
            io.interactive()

    finally:
        io.close()


if __name__ == "__main__":
    main()
The script is intentionally boring. That is a feature. During a competition, a predictable harness leaves your attention available for reversing and exploit reasoning.
Why each piece exists
exe = context.binary = ELF(BINARY) loads ELF metadata into pwntools and configures its architecture, bitness, and endianness from the target. This means that helpers such as p64(), u64(), asm(), and cyclic-pattern tools use the correct defaults. It also gives you access to information such as exe.symbols, useful later when a binary retains symbols.
The GDBSCRIPT is a small initialization program for GDB. Here it:
- Disables pagination, so GDB will not pause output with
--Type <RET>--. - Selects Intel disassembly syntax.
- Sets a temporary breakpoint at
main. - Continues execution until that breakpoint.
Using gdb.debug() is preferable to launching a process and attaching later when you need to inspect very early behavior. The debugger is ready before your exploit starts sending data, eliminating an attachment race.
The exploit(io) function receives the tube. It does not need to know whether io came from process, gdb.debug, or remote. That is the key abstraction.
Running the same script in useful modes
With the harness in place, use modes deliberately rather than treating GDB and debug logs as an afterthought.
# Run the local binary normally
python3 solve.py

# Run locally, with every send and receive logged
python3 solve.py DEBUG

# Run the local binary under GDB/GEF
python3 solve.py GDB

# Run under GDB and retain byte-level logs
python3 solve.py GDB DEBUG

# Connect to the configured remote service
python3 solve.py REMOTE

# Override a remote endpoint without editing the script
python3 solve.py REMOTE HOST=ctf.example.net PORT=41234

# Save pwntools logs while testing a remote connection
python3 solve.py REMOTE HOST=ctf.example.net PORT=41234 DEBUG LOG_FILE=traffic.log

# Increase tube-operation timeouts for a slow service
python3 solve.py REMOTE HOST=ctf.example.net PORT=41234 TIMEOUT=8
During initial local diagnosis, you may also use:
python3 solve.py GDB DEBUG NOASLR
NOASLR can make local observations easier to reproduce, especially while locating an offset or confirming a code path. It is not a solution to ASLR. Once the exploit works, test it again with ASLR enabled. A script that only works under NOASLR is evidence that it still contains an address assumption to fix.
DEBUG is especially valuable because it shows exact byte strings, including null bytes and non-printable packed addresses. If the service says only “wrong,” a debug log can reveal that you sent a newline too early, waited for the wrong prompt, or accidentally passed text where raw bytes were needed.
For a cleaner final submission, omit DEBUG, or use SILENT when you need to suppress ordinary pwntools output. Be conscious that traffic logs can contain flags, session tokens, or challenge credentials; treat them as sensitive artifacts.
GDB integration: make the debugger part of the script
You already use GEF for registers, stack inspection, cyclic patterns, and disassembly. The harness makes those observations repeatable: you run the same payload-generation code each time, while GDB halts at a known location.
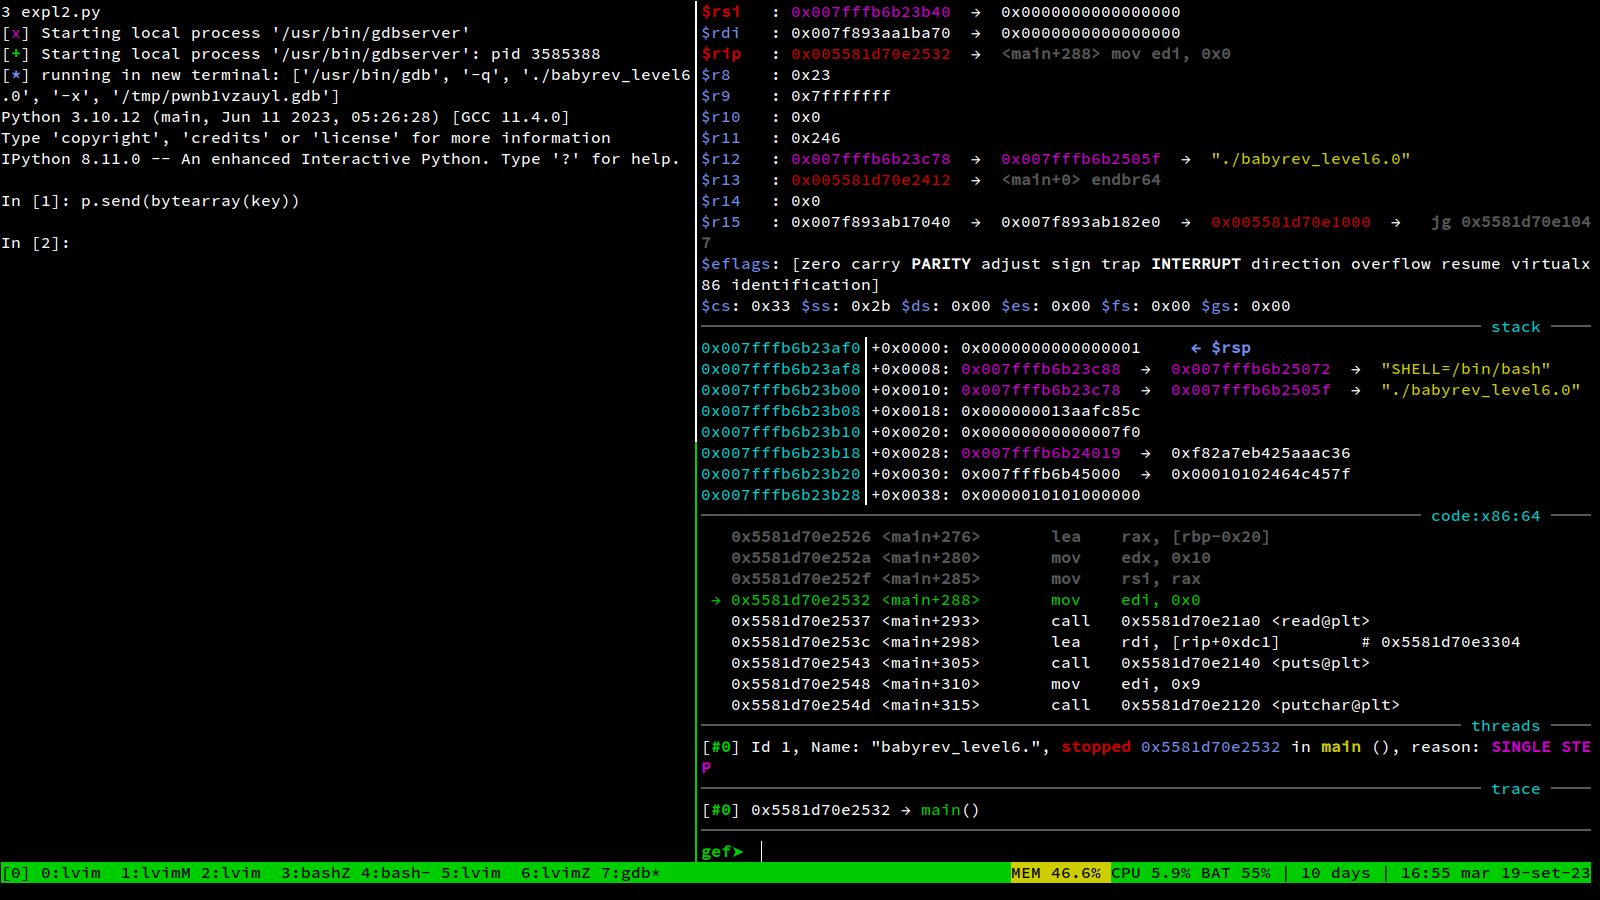
When python3 solve.py GDB stops at main, adjust the GDB script to suit the current hypothesis. For example:
GDBSCRIPT = """
set pagination off
set disassembly-flavor intel
break vulnerable
continue
"""
Or, when you know the point immediately after an input function returns:
GDBSCRIPT = """
set pagination off
break *main+123
continue
"""
Use symbolic breakpoints where possible, because they remain readable. Use an offset such as main+123 only after confirming it against the current local binary. For PIE binaries, letting GDB resolve main is usually safer than copying a runtime address from a previous run.
The following short demonstration is useful for seeing the simpler gdb.attach() approach. Your harness uses gdb.debug() instead because it starts the program under debugger control from the beginning.
Pwntools & GDB for Buffer Overflow w/ Arguments (PicoCTF 2022 #43 'buffer-overflow2')
Watch John Hammond’s “Pwntools & GDB for Buffer Overflow” for a compact demonstration of attaching GDB to a pwntools-created process.
Watch the attachment. Notice that GDB commands can be supplied from Python, so a debugging setup can be reproduced rather than entered manually every run. Compare this attach-after-start approach with the harness’s gdb.debug() mode, which avoids missing fast early execution.
A remote CTF socket normally cannot and should not be debugged with your local GDB. The correct workflow is to reproduce its behavior locally with the supplied binary and any available libc/loader files, then use the remote service only to validate the final exploit.
Template generation versus an understood harness
Pwntools can generate larger starting scripts with pwn template. This is useful when a challenge supplies an SSH target or when you want a full scaffold immediately. Generated templates can include remote process execution over SSH, local/remote switching, GDB helpers, and standard comments.
Pwnable.kr: fd - Pwntools Blog
Read this Pwntools Blog example to see the conventional generated-template layout and the command-line workflow around it.
In the “Pwntools Script Templates” section, skim the generated script and focus on its local, remote, and start functions. Read the template explanation for the role of pwn template. Then read “Debugging Locally,” especially the GDB and DEBUG discussion. The example uses an older 32-bit target and SSH-specific setup, so treat those details as optional variants rather than requirements for your baseline TCP harness.
For most beginner and intermediate pwn challenges, your smaller template is easier to maintain. It contains exactly the modes you need:
- local process execution;
- GDB/GEF launch;
- remote TCP connection;
- configurable endpoint;
- logging and timeout controls;
- a single location for challenge-specific exploit logic.
A disciplined local-to-remote workflow
When a new challenge arrives, use the harness in this order:
- Start locally with ordinary logging and verify you understand the prompts and input boundaries.
- Turn on
DEBUGwhen output parsing or binary payload delivery behaves unexpectedly. - Use
GDB DEBUGto correlate the logged payload with registers, stack contents, and control flow. - Move the identical exploit logic to
REMOTEonly after the local result is repeatable. - Save a successful remote transcript with
LOG_FILEif the challenge permits it, particularly when the service is unstable or its protocol is multi-stage.
A small improvement worth adopting now is to log major assumptions in the exploit body:
log.info(f"Payload length: {len(payload)} bytes")
log.info(f"Offset: {offset}")
log.info(f"Target function: {exe.symbols['win']:#x}")
These messages are not decoration. When a script fails after an edit, they tell you whether the input changed, the computed offset changed, or the script reached a different stage than expected.
Key takeaways
A reusable pwntools harness makes exploit development reproducible across environments:
process()andremote()return compatible tubes, so exploit code can remain unchanged.- Put environment selection in one
start()function and place challenge-specific behavior inexploit(io). - Use
gdb.debug()when you need debugger control before the target receives exploit input. - Use
DEBUG,LOG_FILE, andTIMEOUTfrom the command line rather than repeatedly editing source. - Use
NOASLRonly as a local diagnostic aid, then retest under normal ASLR. - Treat local debugging and remote validation as different phases of one workflow.
In the next lesson, you will turn the confirmed primitive, mitigation results, and this reproducible harness into a mitigation-aware exploitation plan: what must be leaked, what code or data targets are viable, and which assumptions you must verify before committing to an exploit path.
Can't find a good explanation? Sign up and we'll make it for you
Sign up