
Hello. Last lesson established the key distinction between physical and chemical changes: a physical change preserves a substance’s identity, while a chemical change produces new substances. Particle diagrams let us see that distinction directly, because they show what cannot be seen in an ordinary observation: how particles are grouped and arranged before and after a change.
In this lesson, you will learn to read a particle diagram as a before-and-after model. You will identify the particles present, compare how atoms are connected, check that atoms are conserved, and decide whether the diagram shows a physical or chemical change. This completes the particle-level part of the Matter and Chemical Change Review module and prepares you to justify classifications using multiple kinds of evidence.
Reading a particle diagram: particles, atoms, and snapshots
A particle diagram is a simplified model of matter. Each coloured shape or sphere represents an atom of a particular element. A key or legend tells you which is which. Spheres that touch are usually meant to be part of the same particle:
- One sphere can represent a single atom, such as an atom of a metal.
- Two or more identical joined spheres can represent a molecule of an element, such as .
- Different joined spheres represent a compound particle, such as .
The boxes on either side of a change represent two snapshots:
- Before: the particles initially present.
- After: the particles present following the change.
Do not decide based only on whether the particles look closer together, more spread out, or more disordered. First identify which atoms are joined together. That grouping tells you the substance’s identity.
Physical and Chemical Changes in Chemistry: Definitions, Examples & Indicators
Read the Physics Classroom explanation to see the central visual test: whether particles have kept the same identity or formed new groupings.
In “Particle Diagrams for Physical Changes,” read from the opening explanation and inspect the diagram beneath it. Notice that a different arrangement does not necessarily mean a different substance. Then read the short paragraph under “Explanation and Examples of Chemical Changes” beginning with the explanation of bonds. Finish with “Particle Diagrams for Chemical Changes,” especially the sentence beginning with the comparison instruction. Focus on the difference between an atom’s type, which is conserved, and its grouping with other atoms, which can change.
A useful way to annotate any diagram is to make a short inventory. For example:
| What you see | What it means |
|---|---|
| Three separate blue-red pairs | Three molecules of one compound |
| Two joined green-green pairs | Two molecules of an element |
| Eight single grey circles | Eight individual atoms of an element |
| Blue-red pairs before and red-blue pairs after | Same substance; the drawing orientation is irrelevant |
The last row matters. A molecule can rotate or move, so its identity depends on the types and numbers of atoms joined, not on whether it is drawn vertically, horizontally, or upside down.
The physical-change pattern: same particles, different arrangement
In a physical change, particles themselves remain the same. Their spacing, motion, location, or arrangement may change, but no new particle types appear.
For example, imagine a diagram with several identical two-atom molecules packed in an orderly pattern on the left and the same two-atom molecules far apart on the right. This represents a change of state, such as a solid becoming a gas. The particles are still the same molecules; only their arrangement and spacing have changed.
Common visual patterns for physical changes include:
| Diagram feature | Likely interpretation | Why it is physical |
|---|---|---|
| Same particles become farther apart | Melting, boiling, or evaporation | The substance is unchanged. |
| Same particles become closer together | Condensation or freezing | The substance is unchanged. |
| A regular arrangement becomes random | A solid becomes a liquid | Particle positions change, not particle identity. |
| Two existing particle types become mixed evenly | Dissolving or mixing | Both substances remain present. |
| Large groups become smaller groups of the same material | Breaking, cutting, or crushing | No new substance forms. |
The total number of individual particles may look different in some diagrams because diagrams are models, but the important test is whether the same kinds of particles appear before and after. If every water molecule is still a water molecule, for instance, the change is physical whether those molecules are solid, liquid, or gas.
The chemical-change pattern: atoms regroup into new particles
In a chemical change, atoms are rearranged. Bonds in the reactants break, new bonds form, and the products contain particles that were not present at the beginning.
Two rules operate together:
- Atoms are conserved. A hydrogen atom remains hydrogen, an oxygen atom remains oxygen, and so on.
- Particle groupings can change. The atoms can be connected in new combinations, forming new substances.
This is why a chemical diagram may show a different number of molecules after the reaction. Molecules can split apart or combine, but the total count of each type of atom must remain the same.
Here is the particle-diagram version of conservation:
| Incorrect interpretation | Correct interpretation |
|---|---|
| “There are fewer particles after, so atoms disappeared.” | Particle number can change; count each kind of atom instead. |
| “The blue atom became a green atom.” | An atom cannot change from one element into another in an ordinary chemical reaction. |
| “The colours are the same, so no reaction happened.” | The same atoms can be regrouped into completely new particles. |
| “A state change cannot occur during a chemical reaction.” | A chemical change can also involve particles becoming more spread out or condensed. The decisive feature is new particle groupings. |
This atom-counting check is particularly useful when diagrams are crowded or when leftover reactant particles appear after the reaction.
A four-step method for interpreting any change diagram
Use this method consistently rather than guessing from appearance.
1. Read the key
Identify what each colour or shape represents. Do not assume, for example, that a blue sphere is always oxygen; the legend controls the meaning.
2. Identify the particles before and after
Look at the groups of touching spheres. Write a quick description of each type:
- “black-black” might be a two-atom molecule of one element;
- “black-green” might be a compound particle;
- a single grey sphere might be an individual atom.
Ignore their locations for the moment. Focus on their composition.
3. Compare the groupings
Ask:
Are the same kinds of particles present after the change, or are atoms connected in new ways?
- Same groupings: physical change.
- New groupings: chemical change.
4. Count atoms of each element
Count each atom type on both sides. For a correctly drawn reaction, each element’s total should match. This confirms that the diagram models rearrangement, not creation or loss of atoms.
A complete interpretation should name the type of change and state the particle-level evidence:
“This diagram shows a chemical change because atoms that were originally in separate particles are joined into new particles after the change. The number of each type of atom is conserved.”
Or:
“This diagram shows a physical change because the same particles appear before and after the change. Only their spacing and arrangement change.”
Worked interpretation: three chemical changes
The following diagram contains three chemical changes. Its atom key identifies black as hydrogen, grey as carbon, light blue as oxygen, and green as chlorine.
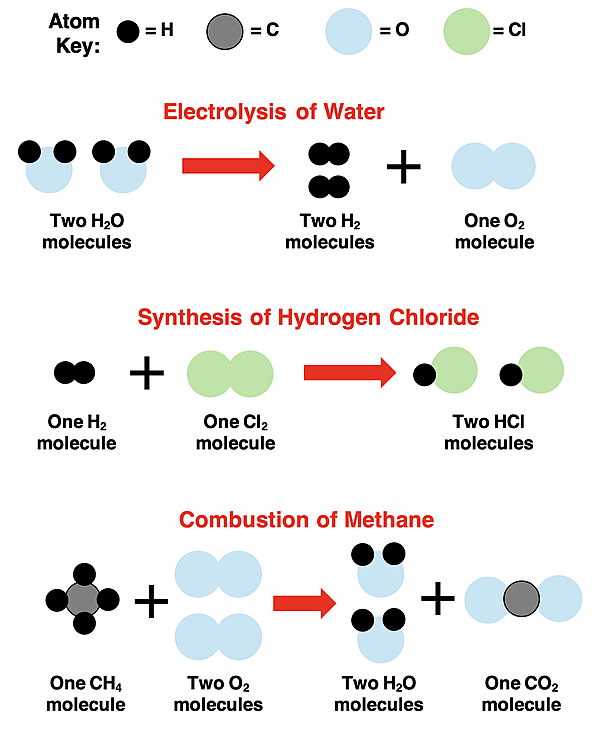
Electrolysis of water
Before the change, there are two water molecules. Each water molecule contains two hydrogen atoms and one oxygen atom, so the starting sample contains:
- four hydrogen atoms
- two oxygen atoms
After the change, the diagram shows two hydrogen molecules and one oxygen molecule. The atoms are conserved:
- two molecules contain four hydrogen atoms total;
- one molecule contains two oxygen atoms total.
However, the particle types have changed. Water molecules are no longer present; hydrogen and oxygen molecules are present instead. Therefore, electrolysis is a chemical change.
Synthesis of hydrogen chloride
Before the change, the diagram shows one hydrogen molecule, , and one chlorine molecule, . Afterward, there are two hydrogen chloride molecules, each made of one hydrogen atom joined to one chlorine atom.
The atom inventory is unchanged:
| Element | Before | After |
|---|---|---|
| Hydrogen | 2 | 2 |
| Chlorine | 2 | 2 |
But the grouping changes from hydrogen-hydrogen and chlorine-chlorine to hydrogen-chlorine. New compound particles form, so this is a chemical change.
Combustion of methane
Before the change, one methane molecule contains one carbon atom joined with four hydrogen atoms. Two oxygen molecules provide four oxygen atoms total.
Afterward, the diagram shows:
- two water molecules, each containing two hydrogen atoms and one oxygen atom;
- one carbon dioxide molecule containing one carbon atom and two oxygen atoms.
Count the atoms:
| Element | Before | After |
|---|---|---|
| Carbon | 1 | 1 |
| Hydrogen | 4 | 4 |
| Oxygen | 4 | 4 |
The atoms are conserved, but methane and oxygen molecules have been rearranged into water and carbon dioxide molecules. This is a chemical change.
Notice a subtle but important point: the reaction begins with three molecules and ends with three molecules in this example, but that is a coincidence. Particle count is not the criterion. New molecular groupings are.
Reading diagrams with mixtures and leftovers
Some diagrams show more than one type of particle in the same box. That can mean either a mixture or a reaction mixture.
If a diagram begins with separate red-red and blue-blue particles, then ends with red-blue particles plus some red-red particles, the red-red particles may be unreacted material left over. The important evidence of a chemical change is still the appearance of red-blue particles, which are new.
Use this distinction:
- Particles merely placed together, unchanged: a mixture or physical change.
- New particles appear, even if some original particles remain: a chemical change has occurred.
For example, if a substance dissolves in water, a diagram may show the original solute particles distributed among water particles. If neither kind of particle changes internally, the process is physical. By contrast, if the solute and water particles disappear and different joined groups appear, the diagram represents a reaction.
The LibreTexts examples provide a useful comparison between these two patterns.
4.6: Physcial and Chemical Changes- the Nanoscopic Level - Chemistry LibreTexts
Use this Chemistry LibreTexts reading to compare several particle-level physical changes with several chemical changes. Its diagrams emphasize the exact visual distinction you need to make.
In “Physical Changes,” study the three diagrams and read from the explanations of the examples. Then read the concluding paragraph beginning with the general rule. Next, under “Chemical Changes,” examine the three diagrams and read from the comparison of new particle formation. As you read, identify one diagram where particles stay unchanged and one where they are regrouped; this contrast is the fastest way to classify an unfamiliar diagram.
A final checklist for exam questions
Before committing to an answer, check the diagram in this order:
- Use the atom key to identify every atom type.
- Treat touching atoms as one particle unless the diagram says otherwise.
- List the particle types on the before side and the after side.
- Look for new groupings of atoms.
- Count each atom type on both sides to verify conservation.
- Classify and justify the change using the particle evidence.
Avoid these common errors:
- Calling a change chemical merely because particles spread out.
- Calling a change physical merely because the same atom colours appear on both sides.
- Counting molecules rather than atoms when checking conservation.
- Treating an unreacted particle as proof that no reaction occurred.
- Assuming that a diagram’s neatness or disorder alone determines whether a reaction happened.
Key takeaways
Particle diagrams represent matter as atoms grouped into particles. To interpret a change, compare the particle groupings before and after:
- In a physical change, the same particles remain; only their spacing, arrangement, state, or distribution changes.
- In a chemical change, atoms are rearranged into new particles and therefore new substances.
- During either kind of diagrammed chemical reaction, atoms are conserved: the total number of each element is the same before and after.
- The strongest justification names the particle-level evidence, not simply an observable feature such as spreading out or heating.
Next, you will use this particle-level reasoning together with stated observations to justify the classification of an unknown material.
Can't find a good explanation? Sign up and we'll make it for you
Sign up