
Hello, and welcome to the first lesson in Production Troubleshooting Under Interview Pressure. This module focuses on turning a vague report such as “the application is slow” into a defensible diagnosis using evidence rather than guesswork.
You will begin with one of the most frequent interview and production scenarios: determining whether a Linux host is genuinely CPU-saturated. By the end, you should be able to distinguish high load from CPU contention, identify the processes or threads consuming CPU, and use scheduler evidence to support a conclusion.
CPU utilization is not the same as CPU saturation
A CPU can be busy without causing a performance incident. Utilization asks, “How much of the CPU’s available time is being used?” Saturation asks, “Are runnable tasks waiting because CPU capacity is unavailable?”
That distinction matters. A nightly batch job may keep all CPUs busy and still be acceptable. But if customer-facing request threads are runnable and waiting for CPU, latency rises even when no individual process looks obviously broken.
A practical definition is:
CPU saturation exists when tasks that are ready to run must wait in the scheduler’s run queue for CPU time.
Think in three evidence layers:
| Evidence layer | Core question | Useful tools |
|---|---|---|
| Demand | Is the host experiencing more work than usual? | uptime, /proc/loadavg |
| Utilization | Are CPUs actually busy, and doing what kind of work? | vmstat, mpstat, top |
| Saturation | Are runnable tasks waiting to be scheduled? | vmstat run queue, scheduler latency tools, CPU pressure metrics |
| Attribution | Which processes or threads account for the consumption? | top, ps, pidstat |
Do not skip layers. For example, a high load average may come from disk I/O rather than CPU contention; a busy CPU may be caused by hypervisor steal time rather than your application; and a large process may be normal background work rather than the source of user-visible latency.
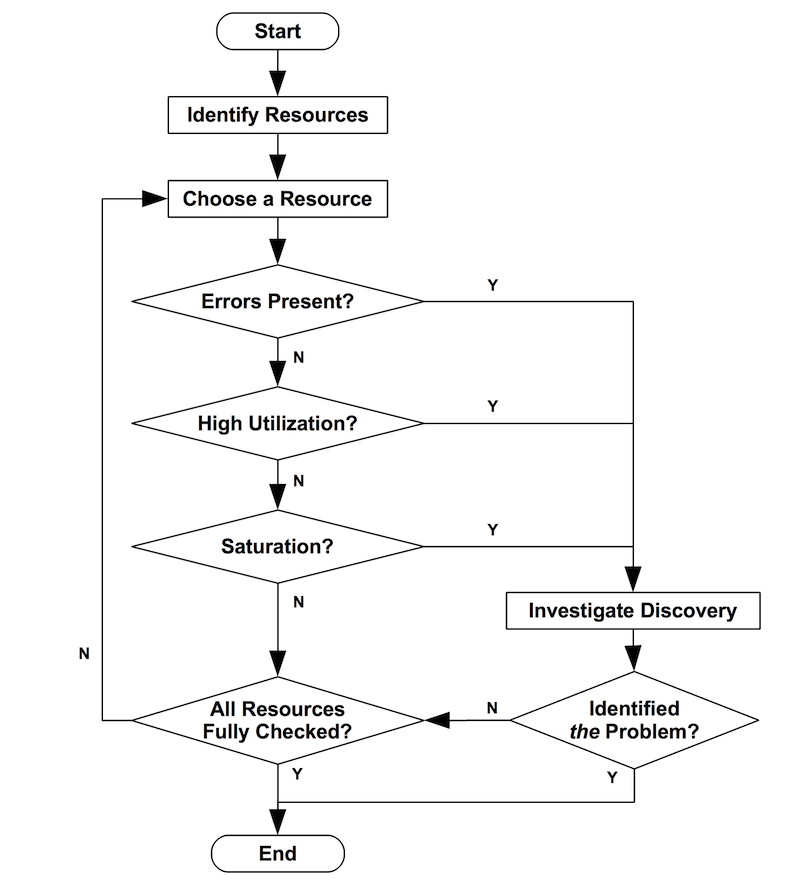
Brendan Gregg’s USE method supplies a useful discipline: for every resource, consider utilization, saturation, and errors. For CPU diagnosis, “errors” are usually less central than utilization and saturation, but they still include signals such as hardware issues or a virtual machine losing CPU time to its hypervisor.
Linux Performance Tools, Brendan Gregg, part 1 of 2
Watch Brendan Gregg’s “Linux Performance Tools, part 1 of 2” for a concise explanation of the USE method and its application to CPU tools. It provides the investigation structure that keeps troubleshooting focused under interview time pressure.
Watch the USE method for the utilization, saturation, and errors framework. Then watch the CPU tools, where Gregg connects uptime, top, vmstat, and mpstat to CPU load, busy processes, and run queue evidence. Focus on why a single metric is insufficient.
Load average: a demand clue, not a CPU verdict
Start a live investigation by recording context:
date
hostname
nproc
uptime
cat /proc/loadavg
uptime reports three load averages, conventionally for the last 1, 5, and 15 minutes. They are exponentially weighted averages, so they show a trend rather than an instantaneous count.
For example:
load average: 9.80, 6.10, 2.35
On an eight-logical-CPU host, this says demand has risen sharply. The one-minute value is much higher than the fifteen-minute value. It does not yet prove CPU exhaustion.
Linux load average counts:
- Tasks currently running or runnable, waiting for CPU.
- Tasks in uninterruptible sleep, commonly displayed as
Dstate, often due to disk, network filesystem, or certain kernel lock waits.
That second category is the essential Linux caveat. A host can show load average 20 while most CPUs are idle if many processes are stuck waiting for I/O. Therefore, the shortcut “load average greater than CPU count means CPU saturation” is unsafe on Linux.
Linux Load Averages: Solving the Mystery
Read Brendan Gregg’s explanation of Linux load averages to build the mental model needed to avoid diagnosing CPU saturation from load alone.
Begin with the opening discussion before the “History” section. Read the basic interpretation, focusing on load as running plus waiting demand and on the meaning of the 1, 5, and 15 minute values. Then read the “Linux Uninterruptible Tasks” section. Read the Linux distinction, especially why D state tasks can elevate load without consuming CPU. Finally, in the “Better Metrics” section, read the CPU metric hierarchy. Notice the distinction between utilization metrics and scheduler-latency saturation metrics.
Reading the trend
The relative values tell a quick story:
| Pattern | Likely interpretation |
|---|---|
| Demand is increasing or a recent spike occurred. | |
| Demand is declining; you may have arrived after the peak. | |
| All values persistently high | Sustained demand, but the constrained resource remains unknown. |
High load with many D tasks | Suspect I/O or lock-related waiting before concluding CPU saturation. |
Normalize load by CPU count only as a rough screening heuristic:
If an eight-vCPU host has a one-minute load of 16, then the rough ratio is . That is concerning, but only after you verify that the load represents runnable CPU demand rather than uninterruptible waits.
Build a synchronized host-level view
During an active incident, open separate terminals or use a multiplexer. Take short, repeated samples rather than relying on a single screen refresh.
vmstat 1
mpstat -P ALL 1
top
The first line from vmstat is an average since boot, so ignore it. Interpret the subsequent one-second samples.
vmstat: the fast system-wide triage tool
A representative vmstat 1 output looks like this:
procs -----------memory---------- ---swap-- -----io---- -system-- ------cpu-----
 r  b   swpd   free   buff  cache   si   so    bi    bo   in   cs us sy id wa st
11  0      0 835000  96000 8140000    0    0     1    16 9200 8400 84 15  1  0  0
For CPU diagnosis, prioritize:
r: number of tasks runnable or running. This is supporting evidence for run queue pressure.b: tasks blocked in uninterruptible sleep. Sustained nonzero values, especially with I/O activity, warn that load may not be CPU-driven.us: CPU time in user space, such as application code.sy: CPU time in kernel space, such as system calls, networking, filesystem activity, or kernel work.id: idle CPU time.wa: CPU time idle while I/O is outstanding. Persistent high I/O wait points away from pure CPU saturation.st: steal time. On a virtual machine, this is time when the hypervisor ran another tenant instead of your vCPU.
A sustained r value greater than the number of logical CPUs is a strong screening signal that tasks are queueing. On a four-vCPU host, an r value around 10 over many samples means more work is runnable than can execute simultaneously. Brief spikes alone are common and not enough to explain a latency incident.
The CPU columns tell you what the host is doing:
- High
uswith lowid, lowwa, and lowstoften indicates application-level CPU demand. - High
symay indicate kernel-heavy work. Do not casually call it “the kernel problem”; identify whether system calls, network processing, filesystem activity, interrupts, or another workload explains it. - High
wasuggests storage latency or I/O contention. - High
stindicates a virtualized-capacity problem: the guest wants CPU, but the hypervisor is not scheduling its vCPU reliably.
mpstat: determine whether saturation is global or uneven
mpstat separates aggregate behavior from per-CPU behavior.
mpstat -P ALL 1
The all row gives an average across logical CPUs. The numbered rows reveal skew.
Suppose an eight-vCPU host has this pattern:
CPU   %usr  %sys  %iowait  %steal  %idle
all   49.0  12.0    0.2      0.0    38.8
0     98.0   1.0    0.0      0.0     1.0
1     97.0   2.0    0.0      0.0     1.0
2      2.0   1.0    0.0      0.0    97.0
...
The host is not globally CPU-saturated: most CPUs are idle. Yet two cores are saturated. That can still cause an application problem if a workload is pinned to those CPUs, has poor thread distribution, receives concentrated network interrupts, or is constrained by affinity rules.
In contrast, if nearly every CPU reports close to zero idle time while vmstat reports sustained runnable queue pressure, you have a much stronger CPU saturation case.

top: find active suspects
Run:
top
Useful interactive keys include:
1to show individual CPU usage.Hto show threads rather than only processes.Pto sort by CPU usage, usually the default.cto expand the command line.
A process at 400% CPU on a host with multiple CPUs usually means it has consumed roughly four logical CPUs’ worth of time during the sampling interval. It is not inherently wrong; it may simply be multithreaded.
Look beyond %CPU:
Sstate:Rmeans running or runnable;Dmeans uninterruptible sleep and should make you investigate I/O or kernel waits.PRandNI: priority and nice values may explain why certain tasks receive more or less CPU time.TIME+: accumulated CPU time identifies long-running consumers, though it will not expose very short-lived processes.
For a scriptable snapshot:
ps -eo pid,ppid,ni,stat,pcpu,comm --sort=-pcpu | head -n 20
This is useful for preserving incident evidence in a ticket or chat channel, but remember that ps is only a snapshot.
Linux Performance Troubleshooting Demos
Watch grobelDev’s “Linux Performance Troubleshooting Demos” to see top, vmstat, mpstat, and pidstat used together during a latency investigation.
Watch the initial triage for the relationship among top, vmstat runnable tasks, CPU time, and I/O wait. Then watch process attribution to see aggregate CPU consumption confirmed with mpstat and attributed with pidstat.
Scheduler evidence: proving that work is waiting
High CPU utilization is suggestive. Scheduler delay is more direct: it measures time a runnable task spends waiting before it can run.
The practical baseline: run queue pressure
On most production systems, vmstat is available and cheap:
nproc
vmstat 1
Use these questions:
- Is
rrepeatedly above the logical CPU count? - Is CPU idle time close to zero at the same time?
- Are
waandstlow enough that I/O waiting or hypervisor contention do not better explain the symptoms? - Does the pattern overlap with the reported latency window?
This is strong supporting scheduler evidence, but it has limits. r is sampled and does not reveal how long each task waited. A run queue of 12 that lasts for milliseconds may be harmless; a run queue of 12 that persists for minutes is not.
Better evidence: scheduler latency
The most meaningful CPU saturation measurement is run queue latency: the interval between a task becoming runnable and being scheduled on a CPU.
Depending on your operating system, kernel version, permissions, and approved tooling, sources include:
perf sched, for scheduler event analysis.runqlatfrom BCC/eBPF tooling, for a latency histogram.- Scheduler statistics or delay-accounting facilities, where enabled.
- Linux Pressure Stall Information, often available through
/proc/pressure/cpu.
For a newer Linux host, inspect CPU pressure:
cat /proc/pressure/cpu
Typical output includes some values such as:
some avg10=18.42 avg60=12.70 avg300=4.15 total=...
CPU pressure marked some records time during which at least one task was waiting for CPU. A sustained and elevated value during the incident is direct evidence of contention, especially when it agrees with high utilization and a growing run queue.
If permitted, collect scheduler events during the active period:
sudo perf sched record -a -- sleep 15
sudo perf sched timehist
Treat this as an escalation step, not your first command. It can require elevated permissions and produces more detail than a short interview usually needs. The conceptual value is important: it reveals scheduling delays rather than merely showing that CPUs were busy.
Context switches are context, not proof
vmstat also reports cs, context switches per second. A high value can arise from thread-heavy workloads, frequent blocking, interrupt activity, or normal concurrent services. It does not establish CPU saturation by itself.
Use context-switch rate to form a hypothesis, then corroborate it with utilization, run queue pressure, and process or thread data.
Attribute CPU consumption to a process and then a thread
After host-level evidence indicates CPU pressure, identify the consumers.
pidstat -u 1
For a suspected process:
pidstat -p <PID> -u -t 1
The -t option exposes threads. This matters because a process may look like a single consumer while one thread is monopolizing a core, or because a service has many CPU-heavy workers.
Use a short evidence sequence:
- Find the highest-CPU process or command with
toporps. - Confirm sustained activity with
pidstat, which samples over intervals. - Break the process into threads with
pidstat -tortop -H. - Compare the process’s user and system CPU behavior against host-level
usandsy. - Establish whether the process is expected work, accidental work, or a symptom of another failure.
For example:
Host:
  4 vCPUs
  vmstat r: 9 to 13 for five minutes
  vmstat CPU: us 82%, sy 16%, id 2%, wa 0%, st 0%
  load average: 10.4, 9.8, 7.1

Process evidence:
  api-worker PID 1842: 385% CPU
  Four worker threads: each near 95% CPU
A defensible conclusion is:
The host is CPU-saturated. All four vCPUs are nearly fully utilized, runnable demand is persistently well above available CPU capacity, and I/O wait and steal time are negligible.
api-workeraccounts for most CPU time through four busy worker threads. The next investigation should focus on the workload or code path driving those workers.
Notice what this conclusion does not claim. It does not assert the root cause is “bad code.” The immediate cause is CPU contention; the underlying cause could be a traffic spike, inefficient release, retry loop, compression task, unexpected batch job, or a change in request shape.
Avoid the common false diagnoses
Case 1: High load, but not CPU saturation
8 vCPUs
load average: 24.0, 22.8, 19.5
vmstat: r 1, b 35, us 4%, sy 3%, id 48%, wa 45%
top: many tasks in D state
The load is high, but CPU idle time remains substantial and I/O wait is high. Many tasks are blocked. Diagnose an I/O-bound or storage-related issue first, not CPU saturation.
Case 2: High CPU, but the virtual machine is being starved
vmstat: r 7, us 20%, sy 4%, id 1%, wa 0%, st 75%
The guest is short of effective CPU capacity, but the decisive clue is steal time. The hypervisor is scheduling other work instead of this VM. Scaling the application’s worker count could make the queue worse; investigate instance sizing, noisy-neighbor behavior, or the virtualization platform.
Case 3: Aggregate CPU seems fine, but one CPU is maxed out
all:  %idle 72
CPU0: %idle 0
CPU1: %idle 0
CPU2-7: %idle 95 or higher
This is not global saturation. Investigate CPU affinity, interrupts, a single-threaded bottleneck, or uneven work distribution. The overloaded cores may still explain latency for a specific service.
Case 4: CPU appears fully busy, but top has no culprit
Short-lived processes may start, consume significant CPU, and exit between top refreshes. In that case, historical tooling, higher-frequency sampling, process-exec tracing, or perf profiling may be required. Do not conclude “the CPU usage is unexplained” simply because a three-second top view missed it.
A concise investigation procedure for interviews
In a timed interview, narrate your reasoning rather than listing commands mechanically:
-
State the hypothesis.
“I will test whether request latency is caused by CPU saturation rather than I/O wait, memory pressure, or virtual-machine steal time.” -
Establish capacity and demand.
Usenproc,uptime, and/proc/loadavg. Explain that load is a clue and that Linux includes uninterruptible tasks. -
Confirm utilization type.
Usevmstat 1andmpstat -P ALL 1. Look for low idle time, highusorsy, and rule out elevatedwaandst. -
Confirm scheduler pressure.
Compare sustainedvmstat rwith logical CPU count. If available, use CPU pressure or scheduler-latency tooling for direct confirmation. -
Attribute the consumption.
Usetop,ps, andpidstat -u -t 1to identify processes and threads. -
State a bounded conclusion and next action.
Say what the evidence supports, what it rules out, and what you would investigate next.
A strong answer sounds like this:
“Load rose from 2 to 14 on an eight-vCPU host, but I would not call that CPU saturation yet because Linux load also includes uninterruptible waits.
vmstatshows runnable tasks sustained around 15, CPUs at 98% busy, negligible I/O wait and steal time. Per-CPUmpstatshows all cores busy, andpidstatattributes most CPU to the application’s request workers. This supports CPU contention as the immediate cause of latency. I would correlate that window with traffic and deployment changes, then profile the worker code path or add capacity as an immediate mitigation.”
Key takeaways
- Load average measures demand, not CPU usage alone. On Linux, it includes runnable tasks and uninterruptible waits.
- Diagnose CPU saturation with a corroborating set of evidence: high CPU utilization, low idle time, sustained runnable queue pressure, and ideally scheduler-latency or CPU-pressure data.
- Use
vmstatto triage demand, CPU breakdown, I/O wait, and steal time; usempstat -P ALLto detect per-core imbalance. - Use
top,ps, andpidstatto move from a saturated host to responsible processes and threads. - Treat high I/O wait, high steal time, and
Dstate tasks as reasons to challenge a CPU diagnosis. - In an interview, communicate the hypothesis, evidence, exclusions, conclusion, and next step.
Next, you will apply the same evidence-driven approach to memory exhaustion and OOM kills: interpreting memory metrics correctly, distinguishing cache from pressure, and tracing kernel OOM events to the process that was terminated.
Can't find a good explanation? Sign up and we'll make it for you
Sign up