Hello! Welcome to your next lesson in the "Resilience and Failure Handling Patterns" module.
In our last few lessons, we've focused on building resilience into our services using patterns like Retry, Circuit Breaker, and Bulkhead. These patterns help our systems survive transient faults and prevent cascading failures. However, they also introduce complexity. When a request fails, it's no longer a simple case of a single service error; it could be due to a timeout, a circuit opening, or a bulkhead rejecting the call.
This brings us to a critical question: in a complex distributed system, how do we understand the lifecycle of a single request? How do we debug an issue that spans multiple services, especially when asynchronous communication is involved?
Today's lesson addresses this by focusing on a foundational pattern for observability: structured logging with correlation IDs. You will learn how to transform your logs from simple text streams into a powerful, queryable dataset that allows you to trace a request's entire journey through your system.
This lesson directly addresses the learning outcome: Implement structured logging with correlation IDs for tracing requests across services.
1. The Need for Structure: From Chaos to Clarity
In a high-load distributed environment like the ones you manage, services generate a massive volume of logs. Traditionally, these logs are often unstructured text messages.
2023-10-27 10:00:01 INFO: Processing payment for order 123.(Payment Service)2023-10-27 10:00:02 INFO: Deducting stock for items in order 123.(Inventory Service)2023-10-27 10:00:03 ERROR: Failed to dispatch order 123.(Shipping Service)
If you're trying to debug a problem with order 123, you'd have to manually grep through logs from multiple services, trying to piece together the story. This is slow, error-prone, and doesn't scale.
The solution is structured logging: the practice of writing logs in a consistent, machine-readable format, typically JSON.
Structured Logging Best Practices: Implementation Guide ...
To understand the fundamentals, let's start with the article 'Structured Logging Best Practices'. It provides an excellent overview of what structured logging is and the problems it solves.
Please read the sections 'What is structured logging?' and 'Why to use structured logging?'. Focus on the contrast between traditional and structured logging and the key benefits listed, such as improved searchability and integration with analysis tools.
As the article highlights, by formatting logs as key-value pairs, we enable powerful, automated analysis. Instead of searching for text, you can run queries like level=ERROR AND service=shipping-service, which is significantly more efficient and reliable, especially when using log aggregation platforms like the ELK Stack, Splunk, or Datadog.
2. The Invisible Thread: Correlation IDs
Structured logging gives us parsable logs, but it doesn't automatically link the logs for a single user request that travels across multiple services. This is where the correlation ID comes in.
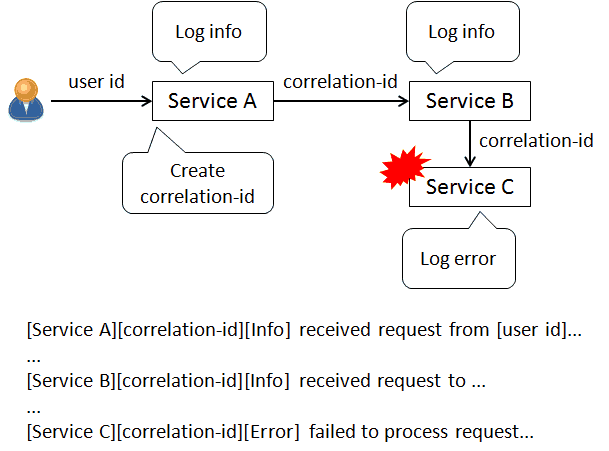
A correlation ID is a unique identifier generated at the beginning of a request's lifecycle (e.g., at the API gateway or the first microservice). This ID is then passed along with the request to every downstream service, both in synchronous (HTTP) and asynchronous (message queue) calls. Each service includes this ID in every log message it writes related to that request.
Correlation ID: The Invisible Thread That Unifies ...
The article 'Correlation ID: The Invisible Thread That Unifies...' provides a focused look at this specific concept.
Read the introduction and the section 'The Problems in Microservice Architecture'. This will solidify your understanding of why a correlation ID is essential for tracing.
This "invisible thread" allows you to filter your entire log database for a single correlation ID and see the complete, ordered story of a request across all services.
3. Practical Implementation in a Java Ecosystem
Given your background in Java and high-load systems, let's dive into a standard, practical implementation pattern using common Java logging frameworks.
The core mechanism for managing request-specific context in a multi-threaded server environment is the Mapped Diagnostic Context (MDC), a feature of logging libraries like SLF4J/Logback and Log4j. The MDC is essentially a ThreadLocal map, meaning any key-value pair you put into it is accessible only to the current thread. Since a web server typically handles each request on a dedicated thread, the MDC is perfect for storing the correlation ID.
The implementation involves three main steps:
- Capture/Generate the ID: Intercept the incoming request, check for a correlation ID header, and generate a new one if it's missing.
- Store the ID: Place the ID into the MDC.
- Propagate the ID: When making outbound calls to other services, retrieve the ID from the MDC and add it to the outgoing request header.
- Clean Up: Crucially, remove the ID from the MDC after the request is processed to prevent it from leaking into another request that might reuse the thread.
Correlation ID: The Invisible Thread That Unifies ...
The 'Correlation ID' article provides excellent code examples for these steps. Let's examine them closely.
Please study the following sections: 'Implementing Correlation ID in Spring Boot', 'Propagating Correlation ID in GraphQL' (conceptually similar for any HTTP client), 'Propagating Correlation ID via Kafka', and the logback pattern under 'Best Practices'. Focus on: The logic within the doFilter method of the CorrelationIdFilter, especially the use of MDC.put() and the finally block for cleanup. How the ID is retrieved from the MDC and added to an outgoing WebClient header. How the ID is added to a Kafka message header by the producer and retrieved by the consumer. The %X{X-Correlation-Id} token in the logback pattern, which automatically injects the MDC value into every log line.
Let's summarize the key implementation points from the article:
- Servlet Filter: A
javax.servlet.Filteris the ideal place to manage the MDC lifecycle for HTTP requests. It wraps the entire request processing chain. - MDC Management: The pattern
MDC.put(...)at the start andMDC.remove(...)in afinallyblock is non-negotiable. It ensures context is correctly isolated and cleaned up, even if exceptions occur. - Log Configuration: Your logging configuration (e.g.,
logback.xml) must be updated to output the MDC data. The pattern[%X{correlationId}]will automatically pull the value associated with the keycorrelationIdfrom the MDC. - Propagation:
- HTTP: For outgoing calls, use an interceptor (e.g., for
RestTemplate,OkHttp, orWebClient) to read the ID from the MDC and add it as a header (e.g.,X-Correlation-ID). - Messaging (Kafka): The producer reads the ID from the MDC and adds it to the
Headersof theProducerRecord. The consumer must then extract this header and place it into its own thread's MDC before processing the message. This step is critical for maintaining the trace across asynchronous boundaries.
- HTTP: For outgoing calls, use an interceptor (e.g., for
4. Best Practices and Common Pitfalls
Implementing this pattern effectively requires adherence to a few key principles to ensure consistency and avoid common mistakes.
Structured Logging Best Practices: Implementation Guide ...
The 'Structured Logging Best Practices' article offers a great high-level view of best practices and potential pitfalls that are highly relevant here.
Please read the 'Best Practices' section, focusing on 'Consistent Field Names' and 'Correlation IDs'. Also, review the 'Common Pitfalls' section, particularly 'Sensitive Data Exposure'.
Here is a consolidated list of best practices:
- Consistent Naming: Agree on a standard header name (
X-Request-ID,X-Correlation-ID) and a standard JSON field name (correlation_id,trace_id) across all services in your organization. This is vital for your log aggregation platform. - Generate at the Edge: The correlation ID should be generated by the first system that touches the request (e.g., your API Gateway, edge proxy, or the first microservice). Always check for an existing ID before generating a new one.
- Propagate Everywhere: Ensure the ID is propagated across all communication boundaries—REST, gRPC, and especially message queues.
- Beyond Correlation ID: Your structured logs should include other valuable context:
service_name,hostname,user_id,tenant_id, etc. This enriches your logs and makes debugging even easier. - Beware of Sensitive Data: Structured logging makes it easy to accidentally log Personally Identifiable Information (PII) or other sensitive data. Implement filters or custom serializers to mask or redact fields like passwords, credit card numbers, and API keys.
- Embrace Standards: For new projects, consider adopting the W3C Trace Context specification, which standardizes the header names (
traceparent,tracestate) for distributed tracing. This ensures interoperability with a wide range of tools.
While we've focused on the foundational pattern, it's worth noting that full-fledged distributed tracing systems like Jaeger and Zipkin (often used with the OpenTelemetry standard) build upon this concept. They enrich the correlation ID with "span IDs" to trace individual operations within a service and automatically measure latency, creating a detailed performance graph of the entire request. Understanding structured logging and correlation IDs is the first and most crucial step toward implementing such advanced observability.
Conclusion
In this lesson, we've established the critical role of observability in managing complex distributed systems. By moving from unstructured text to structured, queryable logs enriched with correlation IDs, you gain the power to trace any request's journey, dramatically reducing the time it takes to debug issues and understand system behavior.
Key Takeaways:
- Structured Logging: Formats log entries as key-value pairs (e.g., JSON), making them machine-readable and easy to query.
- Correlation ID: A unique identifier that links all log entries related to a single request as it flows through multiple services.
- Implementation (Java): Use a
ServletFilterto manage the lifecycle,MDCto store the ID on a per-thread basis, and update your log configuration to include the MDC value. - Propagation is Key: The ID must be passed in headers for both synchronous (HTTP) and asynchronous (message queue) communication to maintain the trace.
Preview of the Next Lesson
Now that we can effectively observe the internal state and behavior of our services, the next logical step is to expose this state to the outside world—specifically, to the infrastructure that manages our services. In the next lesson, we will learn how to configure health checks and readiness probes for graceful service deployment. This will allow orchestrators like Kubernetes and load balancers to automatically determine if a service instance is healthy, ready to accept traffic, or needs to be restarted, enabling robust, zero-downtime operations.