
Good to see you again. In the previous lesson, you learned to define time periods precisely with DATE_TRUNC, DATEADD, and half-open date ranges. That work matters now because a reported total is only meaningful when the report and your verification query use the same metric definition, status rules, and reporting window.
This lesson introduces data reconciliation at its most practical level: checking whether a number displayed in a report agrees with a total you calculate independently from the underlying data. You will learn a disciplined workflow for defining the check, writing a source-of-truth query, comparing values, and investigating a mismatch. This is a core skill for data QA, reporting, and evaluating AI-generated SQL.
A reported number is a claim to test
Suppose a dashboard displays:
Completed Net Sales, January–March 2025: 12,450.00
Do not treat that value as automatically correct just because it appears in Power BI, a spreadsheet, or a polished executive dashboard. Treat it as a claim:
“The sum of
net_salesfor completed orders from January 1 through March 31, 2025 is 12,450.00.”
A reconciliation check tests that claim against a separately authored SQL calculation.
This is different from simply rerunning the report query. If you copy the report’s SQL, any mistake in its date filter, join, or status logic is likely to be copied too. An independent query starts with the business definition, not the existing implementation.
Before writing SQL, make the definition explicit:
| Item | Defined value |
|---|---|
| KPI | Completed Net Sales |
| Source | Order-level fact table |
| Grain | One row per order |
| Formula | SUM(net_sales) |
| Included statuses | COMPLETED only |
| Time window | January 1, 2025 through March 31, 2025 |
| Date boundary method | Start included; April 1 excluded |
| Expected report value | 12,450.00 |
The point is not bureaucracy. If any row in this table is unclear, two analysts can write different “correct” queries and still disagree.
Reconciliation versus validation
Validation checks whether a dataset follows rules. For example:
net_salesshould not be negative.order_idshould not beNULL.order_dateshould not be in the future.- Every order should have a recognized status.
Reconciliation compares one representation of the data with another. In this lesson, you compare a report total with a fresh SQL calculation from its source data.
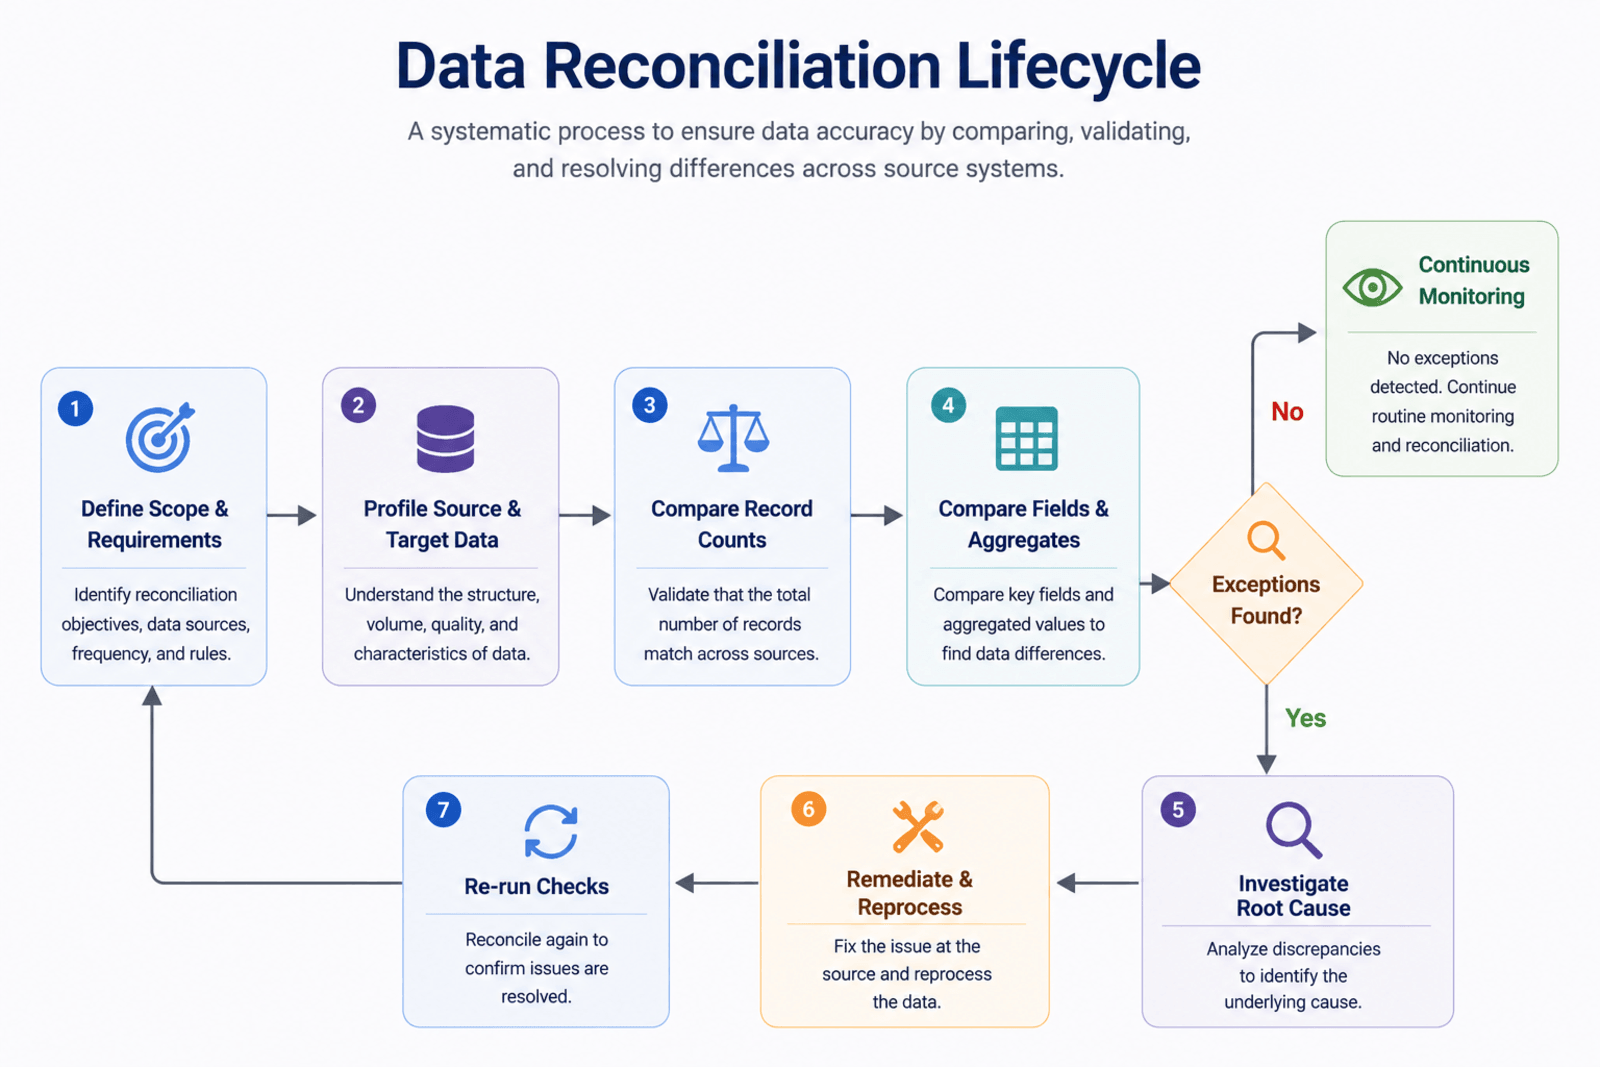
The lifecycle is useful because “the totals do not match” is not a diagnosis. A mismatch is an exception that needs evidence, investigation, and a documented outcome.
The Comprehensive Guide To Data Reconciliation
Read the opening concepts and the comparison workflow in “The Comprehensive Guide To Data Reconciliation.” The article’s tone is informal, but its distinction between validation and reconciliation is useful for report QA.
In “What is Data Reconciliation?”, read the opening definition and focus on why reconciliation establishes trust in reporting. Then, in “6 Key Steps in The Data Reconciliation Process,” read from the “Data Matching/Comparison” discussion beginning with the comparison methods. Finally, in “Data Reconciliation vs. Data Validation,” read the validation explanation, followed by the paragraph beginning “Data reconciliation takes a different approach.” Notice that validation checks rules within data, whereas reconciliation checks agreement between data representations.
Write the independent source-of-truth query
Assume the reporting table contains one row per order:
| Column | Meaning |
|---|---|
order_id | Unique order identifier |
order_date | Date the order was placed |
order_status | Lifecycle status such as COMPLETED or CANCELLED |
net_sales | Net revenue for the order |
From the KPI definition, write the verification query directly against the detailed order table:
SELECT
    COALESCE(SUM(o.net_sales), 0) AS independently_calculated_net_sales
FROM PORTFOLIO_DB.RAW.FCT_ORDER AS o
WHERE o.order_status = 'COMPLETED'
  AND o.order_date >= DATE '2025-01-01'
  AND o.order_date < DATE '2025-04-01';
This query is short, but every line is part of the test:
SUM(o.net_sales)implements the metric formula.COALESCE(..., 0)returns zero rather thanNULLif no qualifying orders exist.order_status = 'COMPLETED'applies the business population rule.- The date range includes January 1 and excludes April 1.
- The source is a detailed fact table, rather than the dashboard visual or reporting aggregate.
Why the date boundary matters
The condition below is deliberate:
o.order_date >= DATE '2025-01-01'
AND o.order_date < DATE '2025-04-01'
It expresses the complete first quarter of 2025 without relying on “end of day” values. If order_date were a timestamp instead, this same half-open pattern would safely include every moment in March.
Avoid vague filters such as:
WHERE EXTRACT(month FROM o.order_date) IN (1, 2, 3)
That would include January through March from every year in the table unless you separately filter the year. Your verification query must be at least as precise as the number being checked.
Independence does not mean different business logic
Both the report and the verification query should apply the same intended business definition. Independence means you do not inherit the report’s implementation without questioning it.
For example, a dashboard may calculate quarterly sales by first creating monthly totals and then adding them in a visual. Your verification query can calculate the quarter directly from raw order rows. The queries have different shapes, but they should return the same final total if the report is correct.
A weak verification method would be:
SELECT
    SUM(monthly_net_sales)
FROM PORTFOLIO_DB.REPORTING.V_MONTHLY_SALES;
If the dashboard is built from V_MONTHLY_SALES, this is not a truly independent check. A bad status filter, duplicated join, or missing month in that view could affect both results.
Compare the report value and calculated value
Once you have:
- The value displayed in the report, and
- The result of your independent SQL query,
compare them explicitly.
For demonstration, assume the dashboard reports 12450.00. You can place that observed value beside the independently calculated total:
SELECT
    r.reported_total,
    c.independent_total,
    c.independent_total - r.reported_total AS variance,
    CASE
        WHEN ABS(c.independent_total - r.reported_total) <= 0.01
            THEN 'PASS'
        ELSE 'FAIL'
    END AS reconciliation_status
FROM (
    SELECT 12450.00 AS reported_total
) AS r
CROSS JOIN (
    SELECT
        COALESCE(SUM(o.net_sales), 0) AS independent_total
    FROM PORTFOLIO_DB.RAW.FCT_ORDER AS o
    WHERE o.order_status = 'COMPLETED'
      AND o.order_date >= DATE '2025-01-01'
      AND o.order_date < DATE '2025-04-01'
) AS c;
This creates one compact QA result:
| reported_total | independent_total | variance | reconciliation_status |
|---|---|---|---|
| 12,450.00 | 12,450.00 | 0.00 | PASS |
For a currency KPI stored to cents, a tolerance of is reasonable when minor display rounding may occur. For a row count, customer count, or order count, the tolerance should normally be exactly zero.
A tolerance is not permission to ignore a meaningful difference. If a report is off by , the result is a failure even if the report looks close at a high level.
Test the definition before trusting a match
A matching total is reassuring, but it is not always sufficient. Two incorrect implementations can sometimes produce the same total by coincidence. Basic supporting checks make the reconciliation more credible.
Start by checking the number of rows contributing to the metric:
SELECT
    COUNT(*) AS completed_order_count,
    COALESCE(SUM(o.net_sales), 0) AS completed_net_sales
FROM PORTFOLIO_DB.RAW.FCT_ORDER AS o
WHERE o.order_status = 'COMPLETED'
  AND o.order_date >= DATE '2025-01-01'
  AND o.order_date < DATE '2025-04-01';
If the total matches but the report’s completed-order count does not, investigate further. A report could contain duplicate rows that happen to offset another error, or it could use a distinct-count measure that differs from the intended definition.
For a period-based KPI, a monthly breakdown is often the fastest way to locate an error:
SELECT
    DATE_TRUNC('month', o.order_date) AS order_month,
    COUNT(*) AS completed_order_count,
    COALESCE(SUM(o.net_sales), 0) AS completed_net_sales
FROM PORTFOLIO_DB.RAW.FCT_ORDER AS o
WHERE o.order_status = 'COMPLETED'
  AND o.order_date >= DATE '2025-01-01'
  AND o.order_date < DATE '2025-04-01'
GROUP BY order_month
ORDER BY order_month;
A quarterly mismatch may now become visible as one problematic month. That is much easier to investigate than a single unexplained total.
When totals differ: investigate systematically
Suppose the report says 12,450.00, but your independent query returns 12,390.65. The variance is:
Do not immediately edit your query until it matches the report. First, compare the possible definitions and assumptions.
1. Check the population
A common problem is a different interpretation of which orders count as sales. For example, one query may use only COMPLETED, while another may include PENDING or REFUNDED orders.
SELECT
    o.order_status,
    COUNT(*) AS order_count,
    COALESCE(SUM(o.net_sales), 0) AS net_sales
FROM PORTFOLIO_DB.RAW.FCT_ORDER AS o
WHERE o.order_date >= DATE '2025-01-01'
  AND o.order_date < DATE '2025-04-01'
GROUP BY o.order_status
ORDER BY o.order_status;
This tells you how much each status contributes. If the report includes a status that the KPI specification excludes, you have evidence for the likely cause.
2. Check the reporting period
Confirm all of the following:
- Does the report include January 1?
- Does it include all of March?
- Does it accidentally include April 1?
- Does it use order creation date, completion date, invoice date, or payment date?
- Is the dashboard filtered to a different year, region, channel, or currency?
The previous lesson’s half-open boundary pattern is especially important if the report uses timestamps.
3. Check for duplicate amplification
If the dashboard query joins orders to a table with multiple matching rows per order, the join can multiply revenue. For example, joining an order to multiple tags can make the same net_sales appear multiple times before aggregation.
A quick source-level check is:
SELECT
    o.order_id,
    COUNT(*) AS rows_per_order
FROM PORTFOLIO_DB.RAW.FCT_ORDER AS o
WHERE o.order_status = 'COMPLETED'
  AND o.order_date >= DATE '2025-01-01'
  AND o.order_date < DATE '2025-04-01'
GROUP BY o.order_id
HAVING COUNT(*) > 1
ORDER BY rows_per_order DESC, o.order_id;
For the raw order table, this should normally return no rows if the intended grain is one row per order. Later in the course, you will use more detailed checks to prove join cardinality before trusting an aggregate.
4. Check refresh timing and source consistency
Even correct SQL can disagree with a dashboard if the underlying data changed between runs. Record:
- When the report was refreshed
- When your query ran
- The database, schema, and table queried
- The selected time window
- The role and warehouse used in Snowflake, once you begin working there
A dashboard refreshed yesterday and a query run after today’s load may be comparing different data snapshots, not different calculations.
Use layered checks, not only one total
A financial total is an important reconciliation check, but it should be supported by related checks. Common layers are:
| Check | What it can reveal |
|---|---|
| Row count | Missing, duplicated, or partially loaded records |
| Total revenue | Incorrect values, filtering, currency, or aggregation issues |
| Monthly totals | A specific broken reporting period |
| Status breakdown | Inclusion of an unintended business state |
| Distinct order count | Duplicates or join multiplication |
| Missing-key check | Orders without a required customer, product, or account link |
Building a SQL ETL Pipeline: The Complete Guide for Data Engineers | Databricks Blog
Read the “Writing Row-Count and Checksum Tests” subsection of the Databricks Blog guide. It connects the simple report-total reconciliation in this lesson to the broader testing practices used in production data pipelines.
In “Testing, Monitoring, and Observability for Data Accuracy” under “Writing Row-Count and Checksum Tests,” read the explanation beginning the row count test. Then read the checksum and financial total discussion. Focus on the idea that one matching aggregate is useful, but row counts and content-level checks provide stronger evidence.
For this course, you do not need to build automated pipeline tests yet. The important habit is to think in layers: a reported metric should be traceable to a defined population of records, not merely accepted because it “looks right.”
Preserve an audit trail
A professional reconciliation result is more than a PASS or FAIL. Keep a concise record that another analyst can reproduce.
A useful reconciliation note contains:
Metric: Completed Net Sales
Report location: Executive Sales Dashboard, Q1 2025 card
Reported value: 12,450.00
Source table: PORTFOLIO_DB.RAW.FCT_ORDER
Metric definition: SUM(net_sales) for COMPLETED orders
Period: 2025-01-01 inclusive to 2025-04-01 exclusive
Independent query result: 12,450.00
Variance: 0.00
Status: PASS
Checked on: [timestamp]
Notes: Report and source query used the same documented status and period rules.
If the result fails, replace the final note with evidence rather than speculation:
Status: FAIL
Observed variance: -59.35
Initial evidence: Dashboard includes PENDING orders; KPI specification states COMPLETED only.
Next action: Confirm intended status logic with KPI owner and correct the report or specification.
This style of writing is valuable in data analyst work because it distinguishes a verified fact from a hypothesis about the cause.
Key takeaways
To verify a reported total reliably:
- Treat the report value as a testable claim, not as the source of truth.
- Define the KPI’s formula, grain, source, filters, and time window before writing SQL.
- Write an independent query from the business definition, ideally against a detailed source table rather than the reporting view.
- Compare the reported value, independently calculated value, variance, and pass or fail status explicitly.
- Use row counts and period or status breakdowns to support the total-level check.
- Investigate mismatches methodically: population rules, date boundaries, joins, duplicates, refresh timing, and source selection are common causes.
- Document the query context and evidence so someone else can reproduce the result.
Next, you will begin using common table expressions, or CTEs, to organize multi-step analytical and verification queries. They will make reconciliation logic easier to read, test, and explain when a simple one-table total is no longer enough.
Can't find a good explanation? Sign up and we'll make it for you
Sign up