
Hello. Last lesson established the first reliable observation channel for your freestanding Rust kernel: serial output from QEMU’s emulated COM1 port. That told you the bootloader reached _start and that your code was running. This lesson adds the complementary tool: a debugger that can freeze the virtual CPU and show its exact machine state.
By the end, you will be able to connect GDB to QEMU, stop the running kernel, inspect the instruction at RIP, read general-purpose registers, and interpret the active stack. These are the core techniques you will use when serial output stops before a useful message, a fault corrupts control flow, or a later exception handler receives an unexpected frame.
The debugging model: one guest, two host-side views
QEMU emulates the guest machine and exposes a GDB remote-debugging server. GDB connects to that server over a local TCP socket. The two programs have distinct roles:
| Component | What it provides |
|---|---|
| QEMU | A virtual x86-64 CPU, RAM, devices, and the current guest state |
| GDB server inside QEMU | A protocol for stopping the virtual CPU and reading or changing its state |
| GDB on the host | Symbol lookup, source display, disassembly, register and stack inspection |
| Kernel ELF file | Debug symbols and source mappings that translate addresses into function names and source locations |
| Bootable disk image | The raw artifact that QEMU boots |
The last distinction is essential. Your bootimage-*.bin file is a bootable disk image; it is not normally the file to give GDB. Give GDB the unstripped Rust ELF executable from target/x86_64-kernel/debug/, since that file contains DWARF debugging information and symbols such as _start.
A debugger does not make a kernel understandable by itself. It provides raw state. Symbols turn an address such as 0x... into _start, and disassembly lets you verify what the CPU will actually execute.
Read Philipp Oppermann’s Set Up GDB for the QEMU/GDB connection model and the basic commands. Its build paths and older Makefile examples differ from your Cargo-and-bootimage workflow, but the -s, -S, target remote, breakpoint, and inspection concepts transfer directly.
Set Up GDB | Writing an OS in Rust
Read “Set Up GDB” by Philipp Oppermann. It explains the QEMU GDB server, why GDB needs the kernel binary with symbols, and the command vocabulary you will apply to the Rust kernel built in the previous lesson.
In the “QEMU parameters” section, read from the explanation of the two QEMU modes, including both command blocks: -s opens the GDB server and -S prevents the guest CPU from starting. Then, in “Connecting GDB,” read the discussion beginning with symbol loading. Translate its kernel-binary path to your unstripped Cargo ELF, not the bootimage disk image. Finally, read all of “Using GDB,” beginning the command overview. Focus on break, continue, step, list, print, and the optional TUI.
Start QEMU as a debuggable target
Build the disk image again after any source changes:
cargo +nightly bootimage
In one terminal, launch QEMU with serial logging, a GDB server, and an initially paused CPU:
qemu-system-x86_64 \
  -drive format=raw,file=target/x86_64-kernel/debug/bootimage-kernel.bin \
  -display none \
  -serial stdio \
  -s \
  -S
The options now mean:
-serial stdiokeeps your kernel log in this terminal.-sis QEMU shorthand for opening a GDB server on local TCP port1234.-Sstarts QEMU with the CPU halted. Firmware, bootloader, and kernel code will not execute until GDB tells it to continue.
The terminal should appear to do nothing. That is correct: no serial text is possible while the guest CPU is frozen.
In a second terminal, start GDB with the kernel ELF. Replace kernel with your Cargo package’s executable name if it differs:
gdb target/x86_64-kernel/debug/kernel
At the GDB prompt, connect to QEMU:
(gdb) target remote :1234
The :1234 form means localhost port 1234. GDB should report that it connected and show the current program counter, though at this earliest point the CPU may still be in firmware startup code rather than your kernel.
Now ask GDB whether it knows the symbol you care about:
(gdb) info functions _start
Set a breakpoint and allow the virtual machine to boot:
(gdb) break _start
(gdb) continue
At a successful stop, GDB should report _start and ideally a Rust source file and line number. QEMU’s first terminal should remain quiet until you continue past the serial-printing instructions.
A realistic early-boot caveat
The referenced GDB setup article documents a historical problem: some GDB versions fail when attached while QEMU transitions from early x86 startup into 64-bit long mode, often with a message resembling Remote 'g' packet reply is too long. This is a toolchain interaction, not evidence that your kernel is wrong.
If it occurs, use the robust “attach to a running kernel” workflow instead:
- Relaunch QEMU with
-sbut without-S. - Wait until serial output confirms that
_starthas run and the kernel is spinning. - Start GDB with the ELF and run
target remote :1234. - Press
Ctrl-Cin the GDB terminal to interrupt the guest CPU.
You will stop in the kernel’s idle spin loop rather than at its first instruction, but you can still inspect instructions, registers, and the stack. This is often the most useful workflow when investigating a kernel that has already reached a stable state.
If GDB says it cannot find _start, check that you launched it with the ELF in target/x86_64-kernel/debug/, not with bootimage-kernel.bin. The latter is for QEMU’s virtual disk, while the former is for GDB’s symbols.
Inspect the instruction stream and registers
Once stopped at _start, start with a compact machine-state snapshot:
(gdb) info registers rip rsp rbp eflags
(gdb) x/12i $rip
The first command shows selected registers. The second examines twelve instructions beginning at the instruction pointer.
The GDB command x/12i means:
x: examine memory;12: display twelve units;i: render each unit as a machine instruction;$rip: begin at the current instruction pointer.
For a fuller source-oriented view, use:
(gdb) disassemble /m _start
The /m option asks GDB to interleave source lines and assembly where debug information permits. If you want to see the raw machine-code bytes too, use:
(gdb) disassemble /r _start
A useful initial register set is:
| Register | Meaning while debugging |
|---|---|
RIP | Address of the current instruction |
RSP | Current stack pointer; the active end of the stack |
RBP | Conventional frame-base register, if the compiler preserved one |
RFLAGS / EFLAGS | Condition and control flags, including interrupt-enable state |
RAX, RBX, RCX, RDX | General-purpose values; their meaning depends on nearby instructions |
RSI, RDI | Often used for arguments by the System V ABI, but do not assume this for arbitrary internal Rust calls |
The register values are not self-explanatory. A value in RAX becomes meaningful only when you relate it to the instructions around RIP. For example, a mov instruction may be constructing a UART port value; a call instruction may be about to enter formatting code; a pause instruction usually indicates the deliberate spin_loop in your kernel’s idle loop.
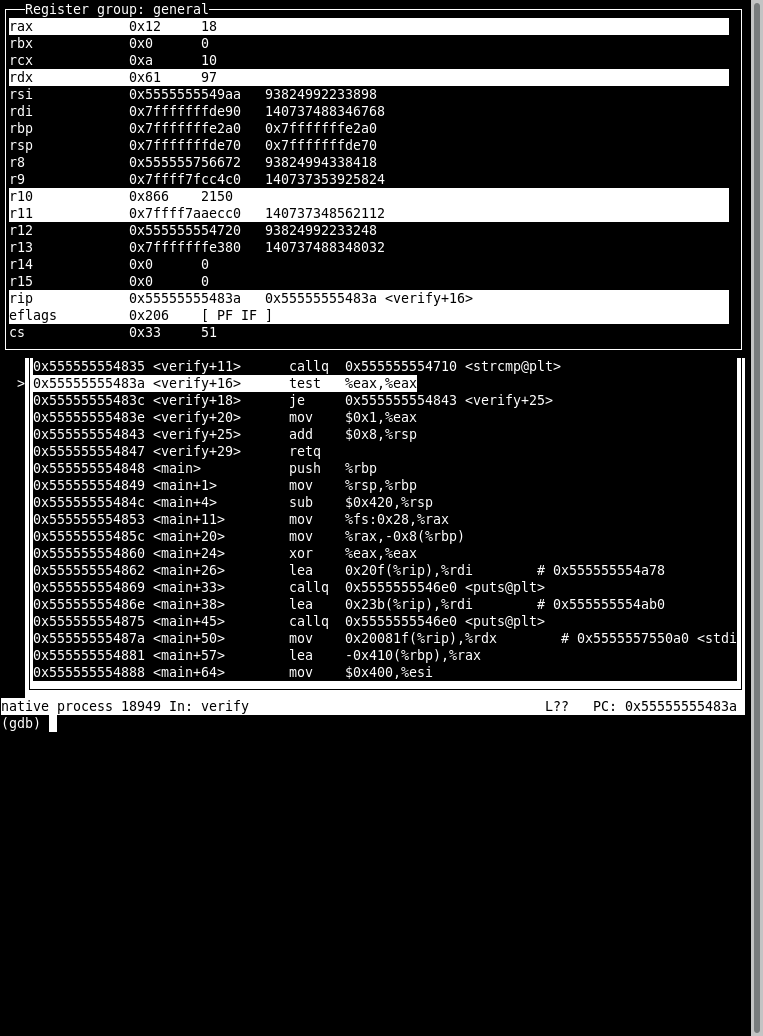
GDB can make this relationship more visible:
(gdb) set disassembly-flavor intel
(gdb) set disassemble-next-line on
(gdb) display/i $rip
These settings use Intel assembly syntax, show an instruction after stepping, and continuously display the instruction at RIP.
To advance at instruction granularity, use:
(gdb) stepi
For a call instruction, nexti generally steps over the callee:
(gdb) nexti
Use this sparingly in early kernel code. Stepping into serial_println! can quickly move from your _start function into formatting, locking, and UART-driver internals. A breakpoint plus disassemble /m is usually a faster way to understand the broad control flow; single-stepping is for verifying a specific instruction-level hypothesis.
Read the stack as evidence, not as a list of variables
The x86-64 stack grows toward lower addresses. RSP marks its current active edge. Calls, saved registers, local variables, compiler spills, and return addresses occupy memory at or above that edge.
Ask GDB for its symbolic reconstruction first:
(gdb) backtrace
(gdb) info frame
backtrace, abbreviated bt, uses debug information and unwind rules to reconstruct active calls. For your small kernel it may show only _start and bootloader-related frames, or it may be partially incomplete. That is still useful information: an incomplete trace often tells you where compiler metadata, unusual entry code, or stack corruption prevents unwinding.
Then inspect the raw words directly:
(gdb) x/16gx $rsp
Here g means an eight-byte “giant word” and x means hexadecimal. Each row is a raw 64-bit memory value. GDB cannot inherently know whether a given word is a local integer, a saved register, a pointer, padding, or a return address.
A common unoptimized function prologue creates a layout approximately like this:
Location relative to RBP | Typical meaning |
|---|---|
RBP + 8 | Return address into the caller |
RBP | Saved caller frame pointer |
Below RBP | Locals, temporary spills, and saved registers |
RSP | Lowest currently allocated address in this frame |
This is a convention, not a promise. The compiler may omit the frame pointer, move values into registers, reserve more stack space than expected for alignment, or inline a function entirely. In particular, a compact no_std kernel must not assume every function has a visible RBP chain.
That is why a sound stack-reading procedure has three stages:
- Use
btandinfo frameto obtain GDB’s symbolic interpretation. - Dump the raw stack at
RSP. - Compare plausible code-address-looking words with a disassembly or a named frame, rather than declaring every large hexadecimal value a return address.
For example, if info frame reports a saved return address, examine it as code:
(gdb) x/8i ADDRESS_REPORTED_BY_INFO_FRAME
Replace ADDRESS_REPORTED_BY_INFO_FRAME with the actual address GDB printed. If the result disassembles into instructions in _start or a caller, you have corroborated the stack interpretation. If it does not, it might be data, a corrupted return address, or an address from a different mapping.
Making future stack traces more legible
For debug builds, preserving frame pointers can make low-level stack inspection more robust, especially when source-level unwind information is incomplete. You can build with:
RUSTFLAGS="-C force-frame-pointers=yes" cargo +nightly bootimage
This is a debugging aid, not a substitute for understanding the stack. DWARF unwind metadata remains valuable, and optimized builds can still make source variables disappear or move between locations. Keep the main kernel development loop in debug mode until you have a reason to measure optimized behavior.
A practical inspection pass
Use this short pass whenever you attach to the spinning kernel:
(gdb) target remote :1234
(gdb) info registers rip rsp rbp eflags
(gdb) x/8i $rip
(gdb) bt
(gdb) info frame
(gdb) x/16gx $rsp
Interpret the result in this order:
- Where is the CPU?
RIPplusx/8i $riptells you whether you are in_start, serial output, a spin loop, or unexpected code. - Does the control state look plausible? Check
RSPis a sensible, stable-looking guest address and thatRIPis in executable kernel code. - What call chain led here? Read
bt, treating it as a hypothesis supported by symbols and unwind metadata. - Does the raw stack support that hypothesis? Use
x/16gx $rspandinfo frametogether. - Only then inspect application values. Commands such as
printcan be helpful, but optimized or low-level code may make a named local unavailable.
When finished, resume execution:
(gdb) continue
Or detach cleanly while letting QEMU keep running:
(gdb) detach
GDB breakpoints are not yet kernel breakpoint handlers
It is important not to confuse two distinct mechanisms:
- A GDB breakpoint is controlled by the external debugger. QEMU stops the guest and reports its state to GDB.
- An x86 breakpoint exception, usually caused by the
int3instruction, is delivered inside the guest through interrupt vector 3. Handling it requires an Interrupt Descriptor Table entry and an exception handler.
At this point, do not insert int3 into the kernel as a debugging shortcut. You have not installed an IDT breakpoint handler yet, so the CPU would be unable to dispatch the exception safely.
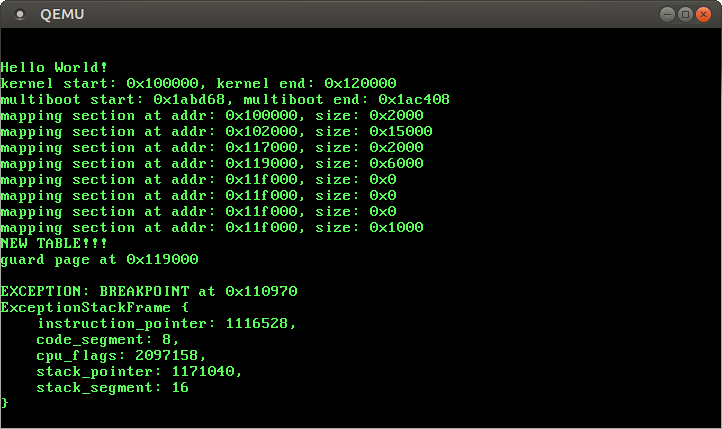
The distinction will matter immediately in the next lesson: you will install a real IDT entry so that a breakpoint exception becomes an observable kernel event with a well-defined saved machine-state frame.
You now have a debugger-driven observation loop for the freestanding kernel. QEMU supplies the running virtual machine and exposes a GDB server; GDB loads symbols from the unstripped kernel ELF, freezes the guest, and lets you relate RIP to instructions, RSP to raw stack words, and symbolic backtraces to physical memory.
The key discipline is to treat registers and stack contents as evidence interpreted in context. A hexadecimal value only acquires meaning when you connect it to the surrounding instructions, symbol table, calling convention, and stack-frame metadata. Next, you will turn an x86 breakpoint from an external debugging convenience into a guest-visible exception by installing an IDT entry and breakpoint handler.
Can't find a good explanation? Sign up and we'll make it for you
Sign up