
Hello, and welcome to the first lesson in your data analytics course. This opening module is about the thinking that comes before Excel, SQL, Power BI, or Python: turning a business concern into a piece of analysis that can genuinely inform a decision.
In workplace analytics, stakeholders rarely arrive with a perfectly formed question. They may say, “Ticket volumes are out of control,” “Why are we missing SLA targets?” or “Can you look for insights?” Your job is not to begin building a dashboard immediately. It is to clarify what decision is at stake, then express the request as one focused question that data can answer.
By the end of this lesson, you will be able to convert a broad stakeholder request into a specific, answerable analysis question—an essential first step for the service-operations projects you will encounter later in the course.
A request is not yet an analysis question
A stakeholder request is often a useful starting point, but it is usually incomplete. It may contain a symptom, an assumption, or an intended deliverable rather than a question that analysis can answer.
Consider these requests:
- “Our service desk is struggling. Find out why.”
- “Can you make a dashboard for ticket performance?”
- “SLA compliance is down. What happened?”
- “We have too many incidents—analyze the data.”
Each signals a real business concern. None tells you precisely:
- what needs to be measured;
- which tickets or teams are in scope;
- what time period matters;
- what comparison defines “down” or “too many”;
- what decision the stakeholder expects to make.
The distinction matters because a technically correct report can still be useless. If an operations manager needs to decide where to assign extra support capacity next month, a broad report on “all ticket trends” may consume time without helping them make that choice.
A strong analysis question acts like a small contract between the stakeholder and analyst:
If we answer this question, what decision will the stakeholder be better able to make?
Before reading any dataset or writing a SQL query, establish that connection.
How to Ask the Right Questions as a Data Analyst | Google Data Analytics Certificate
Watch “How to Ask the Right Questions as a Data Analyst” from Grow with Google. It illustrates the cost of accepting a broad request at face value and shows why the analyst must first understand the purpose of the work.
Watch the opening caution, where the speaker reflects on errors caused by not understanding why an analysis was needed. Then watch the scope story. Focus on the director’s “what actions do we take?” response: it is the test a useful analysis must pass.
The practical lesson is not “ask as many questions as possible.” It is “ask the questions that reduce ambiguity enough to define a decision-focused piece of work.”
Move from the business goal to the analytical question
Organizations tend to speak at several levels at once. A senior leader may name a broad goal; a manager may name an operational objective; an analyst must identify a question whose answer can guide an action.
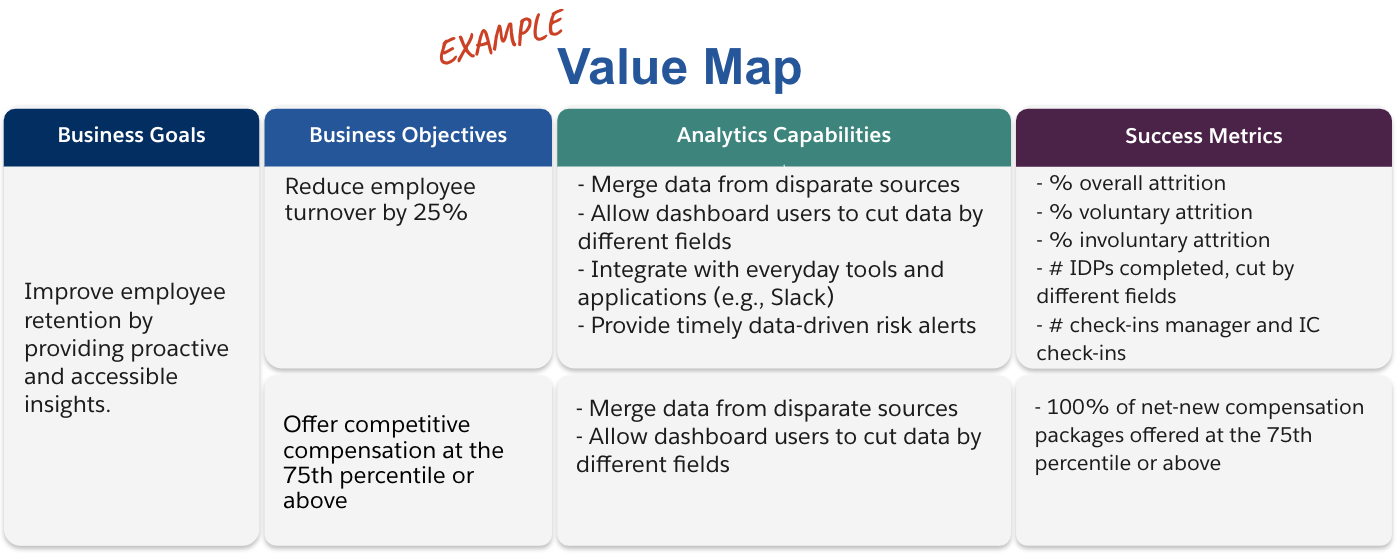
The Value Map shows an HR example, but the logic transfers directly to IT service operations:
| Level | IT service operations example |
|---|---|
| Business goal | Improve employee productivity by reducing disruption from IT issues. |
| Business objective | Improve service-desk SLA performance. |
| Decision | Decide which support area should receive process review or additional capacity. |
| Analysis question | Which assignment group has the highest SLA-breach rate, and has it worsened compared with the previous month? |
| Metric | SLA-breach rate for resolved incidents. |
Notice that “build a Power BI dashboard” is not a business objective, and “analyze the data” is not an analysis question. They describe possible work, not the decision the work should support.
A business goal may lead to many worthwhile questions. That is normal. Your task for a single analysis is to select one question for the immediate decision, rather than trying to answer everything at once.
The ingredients of an answerable question
A useful analytical question is usually built from six ingredients.
| Ingredient | What to clarify | Example |
|---|---|---|
| Decision purpose | What will someone do differently after seeing the answer? | Prioritize an assignment group for an SLA review. |
| Metric or event | What is being counted, summed, averaged, or compared? | SLA-breach rate. |
| Population | Which records are included or excluded? | Resolved incident tickets; not service requests or cancelled tickets. |
| Segment | What categories should be compared? | Assignment group. |
| Time frame and benchmark | When, and compared with what? | May 2025 compared with April 2025. |
| Expected answer form | What kind of result is needed? | Identify the group with the highest rate and quantify the change. |
You do not always need every ingredient in exactly this wording. For example, a one-time inventory count may not need a comparison period. But for operational performance requests, the metric, scope, time frame, and comparison are especially important.
A concise template is:
For [population] during [time period], how did [metric] vary by [segment] compared with [benchmark], so that [decision-maker] can [decision]?
The decision purpose may be kept in the project brief rather than written into the question itself. Including it while you are learning is helpful because it exposes questions that are interesting but not useful.
The SMART checklist offers another way to test your question:
- Specific: Does it ask one clearly defined thing?
- Measurable: Is there a quantity or category that can be observed?
- Achievable: Is the needed information likely available or obtainable?
- Relevant: Does the result support a real decision?
- Time-bound: Is the period explicit?
How to Get Answers from Your Data: A Practical Guide
Read the opening section of “How to Get Answers from Your Data: A Practical Guide.” It contrasts vague requests with actionable questions, then gives a compact SMART checklist for checking whether a question is ready for analysis.
In the section “The Difference Between Vague and Actionable Questions,” read the contrast between the marketing examples. Then continue into “How to Formulate a SMART Data Question” and read the SMART checklist. While reading, identify the metric, segment, and time frame in the actionable example—not merely the fact that it sounds more detailed.
“Achievable” does not mean you must already know the entire database structure. It means you should not promise an answer that clearly requires unavailable information. If a manager asks, “How much revenue did we lose because customers were unhappy with IT support?” but the company has no customer-impact or lost-revenue data, that request is not currently answerable as stated.
A worked translation: from “why are SLAs bad?” to one question
Imagine this stakeholder request from a service-desk manager:
“We are missing too many SLAs. Can you analyze the tickets and tell me why?”
This is understandable—but still too broad.
What is ambiguous?
First, “too many” has no benchmark. Is the manager comparing this month with last month, a target of 95% compliance, or another support team?
Second, “SLAs” may mean different things: time to acknowledge, time to resolve, or compliance with a combined target. An analyst should not silently choose one.
Third, “why” invites a causal explanation. Ticket records can reveal useful patterns—such as breaches being concentrated in one group or priority—but a pattern alone does not prove that group caused the problem. Causes may involve staffing, ticket complexity, system outages, policy changes, or data-quality issues.
For an initial analysis, translate the causal request into a descriptive diagnostic question. This identifies where the problem is concentrated before investigating explanations.
Clarifying conversation
A focused conversation might establish the following:
- Decision: The manager wants to decide which assignment group should receive an SLA process review first.
- Metric: “SLA breach” means a resolved incident whose resolution timestamp was later than its SLA target.
- Scope: Include resolved incident tickets; exclude cancelled tickets and non-incident requests.
- Segment: Compare assignment groups.
- Time and benchmark: Review May 2025 and compare it with April 2025.
Now the request can become:
For resolved incident tickets in May 2025, which assignment group had the highest SLA-breach rate, and how did that rate compare with April 2025?
This is specific enough to answer. Its answer could look like:
“Network Support had the highest May SLA-breach rate at 18%, up from 11% in April.”
That result supports a next action: review Network Support’s workload, staffing, ticket mix, escalation process, or recurring technical issues. It does not prove the explanation. The next analytical question could investigate one possible explanation, but it should be defined separately.
What makes this a good first question?
- It asks for one operational comparison, not “all insights.”
- It defines the population: resolved incident tickets.
- It defines the segment: assignment group.
- It states the period and benchmark.
- It uses a measurable rate rather than the subjective phrase “too many.”
- It leads to a plausible decision.
We will define KPIs much more formally later in this module. For now, recognize that terms such as “SLA-breach rate,” “ticket volume,” and “average resolution time” need agreed business definitions before calculation.
Avoid three common translation errors
1. Treating a deliverable as a question
“Create an SLA dashboard” describes an output. It does not establish what the dashboard needs to answer.
A better starting question is:
“Which assignment groups missed the monthly SLA target in May 2025?”
Once this is defined, you can decide whether a dashboard, spreadsheet, or short written report is the appropriate output.
2. Leaving comparison words undefined
Words such as high, low, better, declining, and improved always require a reference point.
| Vague wording | Specific replacement |
|---|---|
| “Are incident volumes high?” | “Was weekly incident volume in May 2025 above the average weekly volume in April 2025?” |
| “Which team is performing poorly?” | “Which assignment group had an SLA-breach rate above the 5% target in May 2025?” |
| “Has resolution time improved?” | “Did median resolution time for P2 incidents decrease from April to May 2025?” |
You will later learn why a median can sometimes be more useful than an average, but the important idea here is that the question names the exact measure and comparison.
3. Asking for causes before establishing the pattern
“Why did SLA compliance fall?” may eventually become a useful investigation, but it is not usually the first question to run against a dataset.
A disciplined sequence is:
- Describe: Where, when, and for whom did performance change?
- Diagnose: What factors or patterns are associated with that change?
- Recommend: What operational action is justified by the evidence?
For this lesson, stop at the first step. One clear descriptive question is better than an enormous, unbounded “root cause” project.
A short workplace routine
When you receive a request, write a brief translation note before opening Excel or SQL:
Stakeholder request:
Decision to support:
Specific analysis question:
Definitions to confirm:
Assumptions or data limitations:
For the SLA example, the note would be:
Stakeholder request: “Tell me why we are missing too many SLAs.”
Decision to support: Select the first assignment group for an SLA process review.
Specific analysis question: For resolved incident tickets in May 2025,
which assignment group had the highest SLA-breach rate, and how did that
rate compare with April 2025?
Definitions to confirm: What counts as an incident, a resolution, and an SLA breach?
Assumptions or data limitations: Assignment group and SLA target are recorded reliably.
This takes only a few minutes, but it prevents wasted analysis. It also creates a record of what was agreed, which is useful when a stakeholder later asks why a particular metric, date range, or category was used.
Before accepting your final wording, run this quick test:
- Could another analyst understand exactly what to calculate?
- Could the answer fit into a sentence, table, or chart without further interpretation of the question?
- Are the metric, population, time period, and benchmark clear?
- Does the result inform a named decision?
- Have you avoided implying causation that the data cannot establish?
If any answer is “no,” the stakeholder request needs another clarification round.
Key takeaways
A stakeholder’s first request is often a business signal, not an analysis-ready question. Translate it by identifying the decision, metric, population, segment, period, and comparison point. Define ambiguous terms rather than guessing, and begin broad “why” requests with a narrower descriptive question that identifies where the issue appears.
A well-formed question for a service-desk scenario might be:
For resolved incident tickets in May 2025, which assignment group had the highest SLA-breach rate, and how did that rate compare with April 2025?
In the next lesson, you will examine the unit of analysis, also called the dataset’s grain: what one row represents. That is the next safeguard against answering a good question with the wrong calculation.
Can't find a good explanation? Sign up and we'll make it for you
Sign up