
Good to see you again. In the previous lesson, you profiled a dataset: you measured missing values, distinguished duplicate keys from exact duplicate rows, and recorded quality risks before cleaning. That work now becomes an input to planning.
An analysis plan is a short blueprint that connects a business need to the data work required to answer it. It prevents a common beginner mistake: opening a spreadsheet or dashboard first, exploring whatever fields happen to be available, and only later trying to invent a question that fits the charts.
By the end of this lesson, you will be able to write a practical plan that states the business question, scope, required fields, calculations, quality checks, and expected outputs. We will use an IT service-desk scenario similar to the operational reporting you may encounter in a maintenance environment.
From a request to an answerable question
Stakeholders rarely arrive with a fully specified analytical question. They usually describe a concern:
“The ticket backlog seems high. Can you look into it?”
This is a useful starting point, but it is not yet analyzable. Important terms are undefined:
- What counts as the backlog?
- Which tickets are included: incidents, service requests, or both?
- Which period is “seems high” referring to?
- Is the manager looking for a trend, a comparison between teams, or a root cause?
- What decision will the analysis support?
An analysis plan converts the broad request into a question that has a defined population, time period, measures, and comparison.
A working service-desk example
Suppose an operations manager needs to decide where to focus weekly backlog reviews. After a short conversation, the request becomes:
For incident tickets created or resolved from 1 May through 31 May 2024, how did weekly ticket intake, resolution volume, and end-of-week open backlog vary by assignment group and priority? Identify the groups where backlog increased.
This question is specific enough to guide the analysis, while still leaving room for findings.
It contains several deliberate choices:
| Element | Definition in the question |
|---|---|
| Business decision | Which assignment groups need attention in backlog reviews |
| Population | Incident tickets |
| Time scope | 1–31 May 2024 |
| Primary measures | Tickets opened, tickets resolved, open backlog |
| Breakdowns | Week, assignment group, priority |
| Expected finding | Groups with increasing backlog |
| Boundary | The analysis identifies where backlog increased; it does not automatically prove why |
That last boundary matters. A ticket extract might show that a particular group’s backlog grew, but it generally cannot establish the cause. To investigate causes, you may need additional information such as staffing schedules, major incidents, assignment-transfer history, system outages, or changes to support processes.
A sound analysis plan distinguishes:
- descriptive questions — What happened? Where? When?
- diagnostic questions — What factors may explain the pattern?
- causal claims — Did factor cause outcome ?
Do not promise causal conclusions when your available data can support only a descriptive result.
Think of the plan as a chain of evidence
A useful plan follows this logic:
If one link is weak, the final answer is weak. For example, a visually polished dashboard cannot answer a question whose key metric was never precisely defined.
The following short segment gives a helpful overview of this analyst workflow: first define the business issue and success criteria, then identify the information, analysis, and communication needed.
How to Think Like a Data Analyst | Step-by-Step Guide
Watch “How to Think Like a Data Analyst | Step-by-Step Guide” by Maven Analytics for a high-level view of moving from a business problem to metrics, data preparation, exploration, and communication.
Watch problem and metrics to see why the business issue, decision makers, desired outcome, and KPIs must be clarified before analysis begins. Then watch data to outputs for the connection between data quality, analysis, visual exploration, and communicating results.
In a workplace, this plan need not be a large formal document. For a focused operational analysis, one or two well-structured pages can be enough. Its purpose is to make the work reviewable before substantial effort is spent on cleaning, querying, or visualization.
The core sections of an analysis plan
Use the following eight sections as a repeatable structure.
1. Purpose and stakeholder
State who needs the analysis, what decision they are making, and why the question matters.
For the service-desk scenario:
Stakeholder: Service Operations Manager
Decision supported: Prioritize assignment groups for backlog review and operational follow-up.
Purpose: Identify where incident-ticket backlog increased during May 2024.
This is more useful than writing “analyze IT helpdesk data.” The latter names a dataset, not a business purpose.
2. Answerable business question
Write one primary question in ordinary business language. Add subquestions only when they are needed to answer the main question.
Primary question
For incident tickets in May 2024, which assignment groups experienced an increase in weekly open backlog, and was the change concentrated in particular priority levels?
Supporting questions
- How many distinct incident tickets were opened and resolved each week?
- What was the end-of-week open backlog for each assignment group?
- Which groups had more tickets opened than resolved during the period?
- Do high-priority tickets show the same pattern?
Avoid vague wording such as “analyze trends” or “find insights.” A stakeholder should be able to recognize whether the final output answers the question.
3. Scope and exclusions
Scope protects the analysis from expanding endlessly.
| Scope decision | Example definition |
|---|---|
| Ticket type | Incidents only; exclude service requests and change records |
| Reporting period | 1 May to 31 May 2024 |
| Time grain | Weekly, with end-of-week backlog |
| Organizational scope | All assignment groups in the provided extract |
| Ticket lifecycle | Use ticket-level records, not event-history records |
| Exclusions | Exclude records with invalid or missing required dates according to documented rules |
The statement “use ticket-level records” must agree with the dataset grain you identified earlier. If the extract actually contains one row per ticket update, not one row per ticket, counting rows would inflate ticket volume. The plan should state that the grain must be validated before calculations begin.
Map each metric to calculation logic
A stakeholder may say “backlog,” but the analyst must turn that word into an explicit calculation. This is where your previous KPI-definition work becomes essential.
For this scenario, define the measures before selecting a chart or writing a formula.
| Metric | Business definition | Calculation rule | Unit and aggregation |
|---|---|---|---|
| Tickets opened | New incident tickets created in a week | Distinct count of Ticket_ID where Created_Date falls in the reporting week | Tickets, weekly |
| Tickets resolved | Incident tickets resolved in a week | Distinct count of Ticket_ID where Resolved_Date falls in the reporting week | Tickets, weekly |
| End-of-week open backlog | Tickets still open at the end of a reporting week | Distinct count of IDs created on or before week end and unresolved at that point | Tickets, weekly, by group and priority |
| Net ticket flow | Whether workload entered faster than it was resolved | Tickets opened minus tickets resolved | Tickets, weekly |
For a week ending on date , the backlog definition can be written as:
and where either:
or:
The detail in this definition is not unnecessary technicality. Without it, two analysts could produce different backlog numbers while both claiming to report “open tickets.”
A crucial feasibility check
The plan must test whether the available fields can actually support the requested metrics.
For example, if your data dictionary contains only Assignment_Group_At_Resolution, that field can describe where resolved tickets ended up. It cannot reliably describe which group owned a ticket while it was open at the end of each historical week. For that question, you may need one of the following:
Current_Assignment_Group, if the question concerns only the current backlog;- assignment-group snapshots taken at regular intervals;
- ticket assignment-history data, with dates of transfers between groups.
This is not a failure of the analysis. It is a valuable discovery. A good plan names data gaps early instead of quietly using an inappropriate field and presenting a misleading result.
Similarly, if tickets can be reopened, you need a documented business rule. A single Resolved_Date may not fully represent the ticket lifecycle. The first version of a plan can state the assumption explicitly:
Assumption: Each ticket has one creation date and one final resolution date. Reopened tickets are either absent or represented by their final resolution date.
If the source owner says this assumption is false, revise the calculation and data requirements before proceeding.
Build a required-fields map
A field map turns the question and metrics into a concrete list of columns to locate, validate, and use. It should say why each field is needed, not merely list column names.
| Required field | Field type | Used for | Validation or quality rule |
|---|---|---|---|
Ticket_ID | Identifier | Distinct counts; duplicate-key checks | Nonblank; unique if the grain is one row per ticket |
Ticket_Type | Dimension | Restrict analysis to incidents | Confirm valid values and filter rule |
Created_Date | Date | Assign tickets to weekly intake; calculate backlog | Valid date; not after resolution date |
Resolved_Date | Date | Weekly resolution count; backlog calculation | Blank permitted only for tickets that remain open |
Status | Dimension | Validate whether a ticket is open or resolved | Values match documented status list |
Assignment_Group | Dimension | Compare operational workload by group | Must represent ownership at the required point in time |
Priority | Dimension | Segment backlog by urgency | Standardized, valid priority values |
SLA_Breached | Dimension or measure | Optional later context on service performance | Do not treat blanks as “No” |
Notice that SLA_Breached is not required to answer the primary backlog question. It might be useful context, but it should not be added automatically. Keeping a distinction between required and nice-to-have fields keeps the first analysis focused.
The plan should also identify the likely source:
| Data requirement | Likely source | Needed before analysis? |
|---|---|---|
| Ticket-level incident extract | Service-management system export | Yes |
| Assignment history or weekly snapshots | Service-management system history table | Required if reporting historical backlog by owner group |
| Priority definitions | Data dictionary or service-management configuration | Yes |
| Staffing levels | Workforce schedule or team roster | Only if investigating possible causes |
Microsoft’s guidance separates business requirements from technical requirements: define the purpose, metrics, and attributes first, then map those needs to source fields and calculation logic.
Power BI implementation planning: BI solution planning - Power BI | Microsoft Learn
Read Microsoft Learn’s “Power BI implementation planning: BI solution planning” to see how business requirements become a practical solution plan. The terminology is geared toward Power BI projects, but the planning discipline applies equally to an Excel, SQL, pandas, or dashboard analysis.
In the “Gather business requirements” section, read the business-design discussion. Focus on the deliverables: a defined scope, business metrics, business attributes, and a concrete draft output. Then, in “Gather technical requirements,” read the technical-design purpose. Pay particular attention to field-source mapping and calculation logic—the two elements that turn a business question into analyst work.
Include data-quality checks before calculations
Your profile from the previous lesson should appear in the plan as quality checks, not as a separate afterthought.
For the service-desk example, these checks are directly connected to the calculations:
| Check | Why it matters | Planned response |
|---|---|---|
Blank or duplicate Ticket_ID | Can distort distinct ticket counts | Investigate; exclude only with a documented rule |
| Invalid dates | Can place tickets in the wrong week | Flag where resolution precedes creation; correct or exclude according to source guidance |
Blank Resolved_Date | May mean open ticket or missing data | Compare with Status; do not assume every blank is truly open |
| Missing assignment group | Prevents group-level comparison | Report as “Unassigned” only if that is a valid business category; otherwise flag separately |
| Inconsistent priority labels | Splits the same priority into multiple groups | Normalize documented variants before grouping |
| Duplicate ticket versions | Can inflate opened, resolved, and backlog counts | Confirm dataset grain and select the correct versioning rule |
A plan does not need to solve every quality issue immediately. It needs to make the intended treatment visible, including unresolved risks.
For example:
Risk: Twelve excess
Ticket_IDrecords were found in the initial profile.
Impact: Ticket-volume and backlog counts may be overstated.
Decision needed: Confirm whether the source extract contains duplicate exports, ticket versions, or valid event-history records before counting distinct tickets.
That is much stronger than silently removing rows.
Specify the output before building it
Outputs are not simply “a dashboard.” State what the stakeholder will receive, how it answers the question, and what action it supports.
For the example, the initial output could be:
| Output component | Purpose |
|---|---|
| Three KPI cards | Show total tickets opened, resolved, and open at 31 May |
| Weekly line chart | Compare weekly opened tickets, resolved tickets, and end-of-week backlog |
| Bar chart by assignment group | Identify groups with the largest backlog increase |
| Priority breakdown | Show whether the change includes high-priority tickets |
| Small exception table | List groups with backlog growth, the size of growth, and high-priority open-ticket count |
| Short written insight | State the most important quantified finding and limitation |
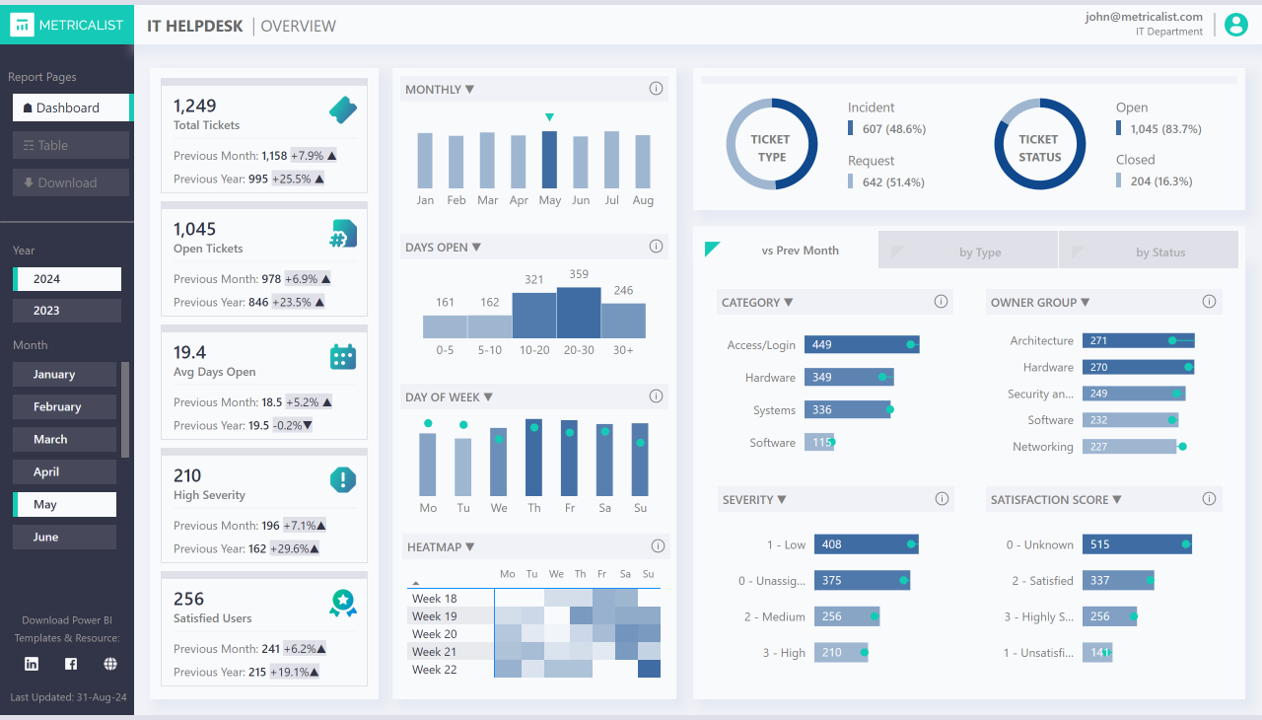
The dashboard shown is useful as inspiration for possible output components, but a generic operational dashboard is not automatically an answer to the May backlog question. A plan must specify, for example:
- whether the “open tickets” card means current open tickets or historical end-of-week backlog;
- whether ticket counts are row counts or distinct
Ticket_IDcounts; - which dates and ticket types are included;
- what the manager should look at or do after seeing the report.
Define acceptance criteria
Acceptance criteria make “done” testable. For this initial analysis, they might be:
- The report covers incident tickets in the agreed May 2024 scope.
- Every KPI has a documented definition, unit, date basis, and aggregation level.
- Ticket counts use distinct
Ticket_IDafter the agreed duplicate-handling rule is applied. - Weekly opened, resolved, and backlog measures reconcile to the filtered ticket-level data.
- The report identifies assignment groups whose backlog increased.
- Missing IDs, duplicate keys, invalid dates, and unassigned tickets are quantified or explicitly excluded under documented rules.
- The final written insight distinguishes observed patterns from unproven explanations.
These criteria are useful when you later verify the same result in Excel, SQL, pandas, and Power BI.
A completed one-page analysis plan
Here is the complete plan assembled in a concise format.
Service-desk backlog analysis plan
Stakeholder and decision
Service Operations Manager; prioritize assignment groups for weekly backlog review.
Business question
For incident tickets created or resolved from 1 May through 31 May 2024, which assignment groups experienced a weekly increase in open backlog, and was the increase concentrated in particular priority levels?
Scope
Include incidents only. Report weekly results for May 2024. Use ticket-level data. Exclude service requests and change records. Confirm whether a historical assignment-group field or assignment history is available before reporting historical backlog by group.
Required fieldsTicket_ID, Ticket_Type, Created_Date, Resolved_Date, Status, assignment-group field appropriate to the time of analysis, and Priority.
Calculations
- Weekly opened tickets: distinct
Ticket_IDbyCreated_Date. - Weekly resolved tickets: distinct
Ticket_IDbyResolved_Date. - End-of-week open backlog: distinct tickets created on or before week end and unresolved as of that date.
- Net ticket flow: opened minus resolved.
- Segment all applicable metrics by assignment group and priority.
Quality checks and assumptions
Check blank IDs, duplicate IDs, invalid date sequences, missing group values, inconsistent priorities, and agreement between blank Resolved_Date and open Status. Assume one creation date and one final resolution date unless ticket-reopen behavior requires a different lifecycle rule.
Output
One report page with KPI cards, a weekly trend view, assignment-group comparison, priority breakdown, exception table, and a short evidence-based written insight.
Acceptance criteria
Metrics reconcile to the agreed filtered dataset; definitions are displayed or documented; data-quality exclusions are transparent; the report identifies where backlog increased without claiming unsupported causes.
A practical planning workflow
Before you begin work in Excel, use this lightweight sequence for a new request:
- Write the stakeholder’s request exactly as you received it.
- Identify the decision the stakeholder needs to make.
- Rewrite the request as one specific question with scope, period, population, measures, and comparison.
- Define every KPI before calculating it.
- Map each metric and breakdown to the minimum required fields.
- Compare required fields against your data dictionary and profile.
- Record quality rules, assumptions, data gaps, and risks.
- Specify the report or deliverable and its acceptance criteria.
- Ask for stakeholder confirmation before investing heavily in analysis.
This planning habit is tool-independent. In later modules, you will implement plans using Excel formulas and PivotTables, SQL queries, Power BI models, and pandas. The plan stays constant; the tool changes.
Key takeaways
An analysis plan is the bridge between an ambiguous stakeholder request and defensible analytical work.
- Begin with the decision and business question, not the available chart types or columns.
- Define the scope: population, period, grain, inclusion rules, and exclusions.
- Translate metrics into explicit calculation logic.
- Map each calculation to required fields, sources, and validation rules.
- Use the prior data profile to identify quality risks that can affect the answer.
- State expected outputs and acceptance criteria so the analysis can be reviewed objectively.
- Treat missing data or unavailable historical fields as visible risks, not problems to hide with assumptions.
You have now completed the data-foundations module. Next, you will move into Excel and begin preparing real extracts: importing a CSV file and converting it into a structured Excel table that can support the analysis plans you have learned to write.
Can't find a good explanation? Sign up and we'll make it for you
Sign up