
Hello! Welcome to your final lesson in the Statistical Foundations for Marketing Leaders module.
In our last session, we drew a critical line between correlation and causation, establishing that the only way to prove a marketing action caused a specific outcome is through controlled experimentation. You learned how to challenge assumptions and ask the right questions to avoid costly misinterpretations.
Today, we take the final and most practical step in this module. We will focus on how to formally structure those questions. This lesson is designed to help you frame a marketing business problem as a statistically testable hypothesis.
This is the bridge between identifying a strategic challenge and briefing your analytics team to test a solution. Mastering this skill will bring structure and rigor to your team's optimization efforts, help you prioritize what to test, and ensure everyone is aligned on the definition of success. It's the capstone skill of this foundational module, translating statistical theory into a powerful leadership tool.
1. From Business Problem to Testable Idea
Every effective A/B test or experiment begins not with a cool idea, but with a clear business problem. You have years of experience identifying these problems: a high cart abandonment rate, low click-through rates on your Meta ads, or poor conversion on a key landing page.
The next step is to move from the problem to a potential solution, framed as a belief. This is the core of a hypothesis.
This excellent article from CXL frames this process perfectly. It suggests that when you've identified a problem but don't have a single, obvious solution, you need to "Hypothesize".
A/B Testing Hypotheses: Using Data to Prioritize Testing
This article, 'A/B Testing Hypotheses: Using Data to Prioritize Testing' from CXL, provides a practical framework for turning business issues into structured hypotheses. We'll focus on their definition and a powerful template for writing them.
Please read the sections 'Translating issues into hypotheses' and the few paragraphs that follow it. Pay close attention to the specific format for writing a hypothesis: 'We believe that doing [A] for people [B]...'.
The CXL article gives us a fantastic, business-friendly structure:
We believe that doing [A] for people [B] will make outcome [C] happen. We’ll know this when we see data [D] and feedback [E].
Let's break this down from a marketing leader's perspective:
- [A] The Change: This is the specific action you want to test (e.g., "rewriting the copy on our product page," "adding customer testimonials").
- [B] The Audience: Who are you targeting? (e.g., "new visitors from organic search," "returning customers on mobile devices").
- [C] The Intended Outcome: What do you expect to happen? (e.g., "better understand our product," "feel more confident in their purchase").
- [D] The Measurable Metric: This is crucial. How will you quantify the outcome? (e.g., "an increase in 'add to cart' clicks," "a higher conversion rate").
- [E] Qualitative Feedback: This is often optional but valuable (e.g., "positive responses in a user survey").
Here is a visual representation of a similar framework. It simplifies the structure into four key parts.
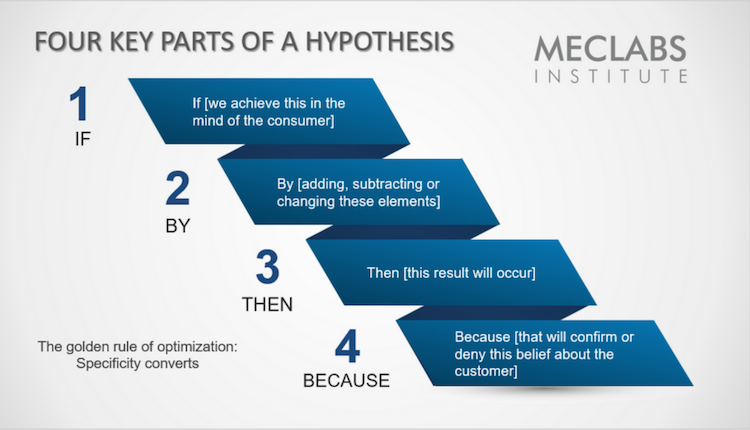
Let's apply this to a common scenario from your world.
- Business Problem: The Cost Per Lead (CPL) from your Google Ads campaigns for a new B2B service is too high.
- Hypothesis using the CXL framework: "We believe that changing the landing page headline from 'Our Innovative Enterprise Solution' to 'Cut Your Reporting Time by 50%' for visitors from our non-branded search campaigns will make our value proposition clearer. We'll know this when we see a 15% increase in the lead form submission rate [D] and no decrease in lead quality [E]."
2. The Components of a Testable Hypothesis
A hypothesis isn't ready for a test until it's clear, specific, and measurable. This means going beyond the general idea and defining exactly what you will measure and for whom.
Before you can even state the formal hypothesis, you must understand the context and choose the right success metric.
A/B Testing in Data Science Interviews by a Google Data Scientist | DataInterview
This video, from a data scientist at Google, outlines the standard process for A/B testing. We'll focus on the initial steps, which are crucial for framing the problem correctly.
Please watch from 1:03 to 8:15. First, notice the emphasis on understanding the business problem and user journey before anything else. Then, pay close attention to the four qualities of a good success metric: measurable, attributable, sensitive, and timely.
As the video explains, a good success metric is your "data [D]" from the CXL framework. Let's apply those four qualities to our Google Ads example:
- Measurable: Is the lead form submission rate measurable? Yes, easily with Google Analytics or your ad platform.
- Attributable: Can we attribute a change in this metric to our headline change? Yes, by running an A/B test where the only difference between the two pages is the headline.
- Sensitive: Is the submission rate sensitive enough to change? Yes, landing page conversion rates are known to be sensitive to headline changes. It's not a metric with extremely high natural variability.
- Timely: Can we measure this quickly? Yes, we don't have to wait months to see the impact on form submissions.
Test your understanding!
Your team wants to improve user retention for your e-commerce mobile app. The business problem is that too few first-time buyers make a second purchase within 30 days. The team proposes running a campaign that sends a "15% off your next order" push notification to users three days after their first purchase.
What would be a good primary success metric for this test? Evaluate it against the four criteria (measurable, attributable, sensitive, timely).
Show answer
A great primary success metric would be the 30-day repeat purchase rate for first-time buyers.
Let's evaluate it:
- Measurable: Yes, you can track which new buyers make a second purchase within 30 days.
- Attributable: Yes, if you create a control group of new buyers who don't receive the push notification, you can attribute the difference in repeat purchase rate between the groups to the campaign.
- Sensitive: This is a good candidate. Repeat purchase rate is a key business metric that should be responsive to targeted promotions.
- Timely: Yes, the outcome is measured within a fixed 30-day window, making the experiment time-bound.
3. Stating the Formal Hypothesis: Null vs. Alternative
Once you have your business problem, your proposed solution, and your key metric, you can translate it into the formal language of statistics. This is what an analyst or data scientist needs to set up the experiment properly.
A statistical hypothesis has two parts:
- The Null Hypothesis (): This is the "default" or "status quo" assumption. It states that your change will have no effect or a negative effect. The experiment is designed to gather enough evidence to reject the null hypothesis.
- The Alternative Hypothesis (): This is what you are trying to prove. It states that your change will have the effect you predict.
Let's look at how this is formally structured.
How to apply hypothesis test in marketing data
This article, 'How to apply hypothesis test in marketing data,' provides clear, simple examples of stating null and alternative hypotheses for common marketing scenarios.
Read the sections 'State the hypotheses', the example under 'Step 1: state the hypothesis' for a t-test, and the example under 'Step 1: state the hypothesis' for a chi-square test. Focus only on how the null and alternative hypotheses are phrased.
Now, let's put it all together using our landing page headline example:
- Business Problem: High CPL on Google Ads.
- Proposed Solution: Change the headline to be more benefit-focused.
- Key Metric: Lead form submission rate (conversion rate).
- Null Hypothesis (): The conversion rate of the new headline is less than or equal to the conversion rate of the old headline. ().
- Alternative Hypothesis (): The conversion rate of the new headline is greater than the conversion rate of the old headline. ().
This formal structure achieves three things:
- It removes all ambiguity.
- It defines the exact metric to be measured.
- It sets a clear condition for success (we need enough evidence to confidently reject in favor of ).
The video we watched earlier also gives a great summary of this step.
A/B Testing in Data Science Interviews by a Google Data Scientist | DataInterview
Let's revisit the 'A/B Testing in Data Science Interviews' video to see how the null and alternative hypotheses are stated in practice, once the business problem and metric are defined.
Please re-watch the short segment from 8:04 to 8:44. Notice how the speaker translates the problem into a clear null and alternative hypothesis about the 'average revenue per day per user'.
Conclusion
Congratulations on completing the Statistical Foundations for Marketing Leaders module! You've journeyed from core probability concepts to the nuances of statistical significance, and finally, to the critical difference between correlation and causation. Today's lesson provided the practical tool to act on that knowledge: the hypothesis.
By framing business problems as testable hypotheses, you create a direct line from a strategic goal to a measurable action, enabling your team to learn and iterate in a structured, data-driven way.
Key Takeaways:
- A strong hypothesis always starts with a business problem, not just a random idea.
- Use a clear structure (e.g., "We believe doing [A] for [B] will cause [C]...") to articulate your proposed solution and its expected impact.
- A hypothesis is only testable if it has a specific, measurable, sensitive, and timely success metric.
- Formally, a hypothesis is stated as two competing claims: the Null Hypothesis (), which assumes no effect, and the Alternative Hypothesis (), which is the outcome you hope to prove.
Preview of the Next Module:
You now have the foundational statistical toolkit to lead a marketing team with confidence. You can interpret results, understand their limitations, and frame problems for rigorous testing.
In our next lesson, we will begin a new module: Strategic Measurement Frameworks. The very first topic is "Distinguish between descriptive, predictive, and causal questions in marketing analytics." This will place the causal questions we learned to frame today into a broader strategic context, helping you understand when to ask "what happened?" (descriptive), "what will happen?" (predictive), and "why did it happen?" (causal), and how to deploy the right analytical resources for each.