
Hello! Welcome to the third lesson in our "Statistical Foundations for Marketing Leaders" module.
In our last lesson, we explored how different statistical distributions describe the "shape" of your marketing data. We saw that understanding this shape—whether it's a normal bell curve, a skewed pattern of customer spend, or a count of daily leads—is the first step toward a deeper analysis.
Today, we build directly on that foundation to tackle one of the most critical skills for any data-driven leader. We will address the learning outcome: Define hypothesis testing, p-values, and confidence intervals for making business decisions.
You've constantly faced questions like: "Did our new ad campaign really outperform the old one?" or "Is this increase in conversion rate a genuine improvement or just random fluctuation?" This lesson provides the formal framework to answer these questions with statistical confidence, moving you from intuition-based to evidence-based decision-making.
1. Hypothesis Testing: A Framework for Making Decisions
Imagine you run an A/B test on a landing page. The new version (B) gets a 3% conversion rate, while the old one (A) gets 2.7%. Is that 0.3% lift real, or could it just be noise? Hypothesis testing gives us a structured process to make this call.
The process starts by setting up two competing statements:
-
The Null Hypothesis (H₀): This is the "no effect" or "status quo" hypothesis. It assumes that any difference you observe is purely due to random chance.
- Example: "There is no difference in the true conversion rates between landing page A and landing page B."
-
The Alternative Hypothesis (H₁): This is the claim you want to prove. It states that there is a real effect or difference.
- Example: "The true conversion rate of landing page B is different from (or higher than) landing page A."
The goal of the test is to see if you have enough evidence in your sample data to reject the null hypothesis in favor of the alternative.
To understand the steps involved, let's turn to a guide written specifically for marketers.
A Marketer's Guide to Basic Statistics (Part 2)
The article 'A Marketer's Guide to Basic Statistics (Part 2)' by Joe Domaleski clearly outlines this decision-making framework. It uses a marketing-friendly example to walk through the core logic.
Please read the section titled 'Hypothesis Testing as a Marketer’s Decision Framework'. Focus on the 4 steps outlined: stating hypotheses, collecting data, comparing the difference, and setting a significance level. This provides the blueprint for everything that follows.
As the article mentions, a key part of this process is setting a significance level (alpha or α) before you run the test. This is your decision threshold. A common choice for α is 0.05 (or 5%). This means you are willing to accept a 5% risk of incorrectly rejecting the null hypothesis (i.e., concluding there's an effect when there isn't one).
2. P-values: Quantifying the Evidence
Once you have your hypotheses and have collected data, you need a way to measure how strong your evidence is. This is where the p-value comes in.
The p-value answers a very specific question:
If the null hypothesis were true (i.e., there's no real effect), what is the probability of observing a result at least as extreme as the one we saw in our data?
Let's break this down:
- A low p-value (e.g., less than 0.05) suggests your observed result is very surprising if you assume there's no real effect. This leads you to doubt the null hypothesis and reject it. Your result is deemed statistically significant.
- A high p-value (e.g., greater than 0.05) suggests your observed result is not surprising under the "no effect" assumption. It's plausible that random chance alone created the difference you saw. You fail to reject the null hypothesis.
The following video provides a clear, step-by-step explanation of this logic.
P-values and significance tests | AP Statistics | Khan Academy
This Khan Academy video, 'P-values and significance tests', walks through the entire hypothesis testing process using a practical example of website engagement.
Please watch from the beginning to 5:27. Pay close attention to how the p-value is calculated and then compared to the pre-defined significance level (alpha) to make a decision.
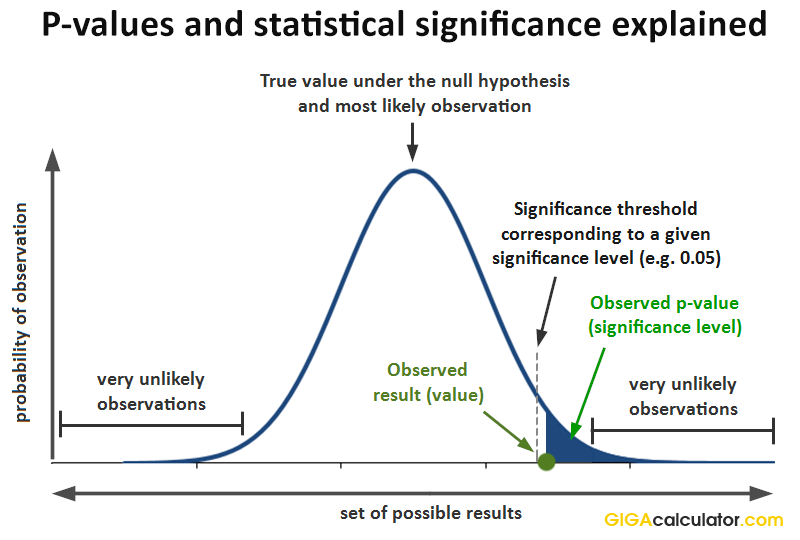
A Crucial Point of Interpretation
One of the most common mistakes in data analysis is misinterpreting the p-value. As a leader, it's vital you get this right.
A p-value is NOT the probability that the null hypothesis is true.
A p-value of 0.04 does not mean there is a 4% chance there's no effect. It means that if there were no effect, you would only see a result this extreme 4% of the time. This subtle distinction is critical for communicating results accurately.
The article from LINK highlights this and other common pitfalls. I highly recommend reading the section "Avoiding Common Statistical Pitfalls," specifically "Pitfall #2: Misinterpreting P-Values."
3. Confidence Intervals: From "If" to "How Much"
While a p-value can tell you if a result is statistically significant, it doesn't tell you the magnitude of the effect. A test might yield a significant p-value, but the actual improvement could be a tiny 0.1%. Is that worth the engineering cost to implement?
This is where confidence intervals (CIs) become incredibly valuable for business decisions.
A confidence interval gives you a range of plausible values for the true effect. For instance, instead of just saying "Campaign B was better," you can say:
"We are 95% confident that the true increase in conversion rate from using Campaign B is between 2.5% and 4.5%."
This is far more actionable. It gives you a best-case and worst-case scenario for the impact, which you can then use in financial forecasts and strategic planning.
Understanding Confidence Intervals and How to Calculate Them
The team at Amplitude, a leading analytics platform, wrote an excellent guide on confidence intervals from a product and experimentation perspective. This resource focuses on practical interpretation for decision-making.
Please read the following sections: 'What is a confidence interval?' for the core definition. 'Confidence intervals in product and web experimentation' to see its relevance. 'P-values' (under 'Confidence interval vs. other statistical measures') to understand how CIs and p-values relate. 'Interpreting confidence intervals' for a practical guide on what to look for.
How to Interpret Confidence Intervals in Practice
As you read in the Amplitude article, here are the key things to look for as a manager:
- The width of the interval:
- Narrow CI (e.g., 2.5% to 3.0%): You have a precise estimate. This usually happens with larger sample sizes.
- Wide CI (e.g., 1% to 15%): Your estimate is not very precise. The true effect could be small or large. This suggests caution is needed.
- The position relative to zero: When you're looking at the difference between two versions (like in an A/B test), check if the interval contains zero.
- CI: [0.5%, 2.5%]: The entire range is positive. This means you have a statistically significant positive effect.
- CI: [-1.0%, 1.5%]: The range includes zero. This means it's plausible there is no real effect. The result is not statistically significant. This is the equivalent of a p-value greater than 0.05.
Test your understanding!
Your team runs an A/B test for a new checkout flow. They present you with three potential outcomes. For each outcome, what is your conclusion, and what action would you take?
- Outcome 1: The p-value for the difference in conversion rate is 0.38. The 95% confidence interval for the lift is [-0.5%, 1.5%].
- Outcome 2: The p-value is 0.01. The 95% confidence interval for the lift is [0.1%, 0.3%]. Your data science team tells you implementing this change will cost $50,000 in engineering time.
- Outcome 3: The p-value is 0.03. The 95% confidence interval for the lift is [2%, 10%].
Show answer
-
Conclusion: The result is not statistically significant. The high p-value and the fact that the confidence interval includes zero both indicate that the observed lift could easily be due to random chance.
- Action: Do not ship the new checkout flow. The data provides no evidence that it's better.
-
Conclusion: The result is statistically significant, as shown by the low p-value and a confidence interval that is entirely positive. However, the magnitude of the effect is very small (a lift of only 0.1% to 0.3%).
- Action: This requires strategic judgment. While the effect is real, it's tiny. Is a 0.2% lift worth a $50,000 investment? Probably not. You would likely decide not to ship this change, as the business impact is too small to justify the cost. This is a perfect example of statistical significance vs. business significance.
-
Conclusion: The result is statistically significant and the potential impact is meaningful. The true lift is likely between 2% and 10%.
- Action: This looks like a clear winner. You can be confident that the new flow has a positive impact. Even in the worst-case scenario (2% lift), the change is likely valuable. You would likely decide to ship this change.
Conclusion
Today, you've learned the fundamental statistical toolkit for making decisions based on experimental data. You are now equipped to go beyond simply looking at the difference in metrics and can now rigorously evaluate whether that difference is real and meaningful.
Key Takeaways:
- Hypothesis Testing is the formal process of using data to evaluate a claim, starting with a "no effect" null hypothesis.
- P-values measure the strength of evidence against the null hypothesis. A low p-value (typically < 0.05) means your result is statistically significant.
- Confidence Intervals are often more useful for business decisions. They provide a range of plausible values for an effect's true magnitude, helping you assess potential impact and risk.
- Decision-Making Rule: A confidence interval for a difference that does not contain zero is equivalent to a statistically significant result.
Preview of the Next Lesson:
We touched on it briefly in the exercise, but the next lesson will dive deep into a crucial concept for any marketing leader: Distinguishing between statistical and business significance. You'll learn how to avoid chasing statistically significant but practically meaningless results, ensuring your team focuses its efforts on changes that truly move the needle for the business.