
Welcome. This course is about turning AI from an occasionally helpful coding companion into a dependable part of your engineering system: one that saves time without quietly increasing review burden, defects, or operational risk.
This first module begins with measurement. Before changing prompts, models, repository instructions, or agent workflows, establish a baseline for the way you work now. Your baseline should describe three recurring AI-assisted task types in terms of time, rework, and defects—not merely how often Claude Code produces a suggestion you accept.
By the end of this lesson, you will have a lightweight measurement protocol you can use across your .NET, Node.js, Elasticsearch, and Kubernetes work without combining confidential client data.
Measure the task, not the AI interaction
AI activity is an input to engineering work. It is not the outcome.
A high suggestion-acceptance rate, many generated lines, or a fast initial implementation can coexist with a slow review, a rewrite after CI, or an incident after deployment. For your purposes, the unit of measurement is a completed task instance: a bounded piece of engineering work with a consistent definition of “done.”
The software value stream makes the distinction clear: value is delivered through planning, building, testing, and deployment—not at the moment code is generated.
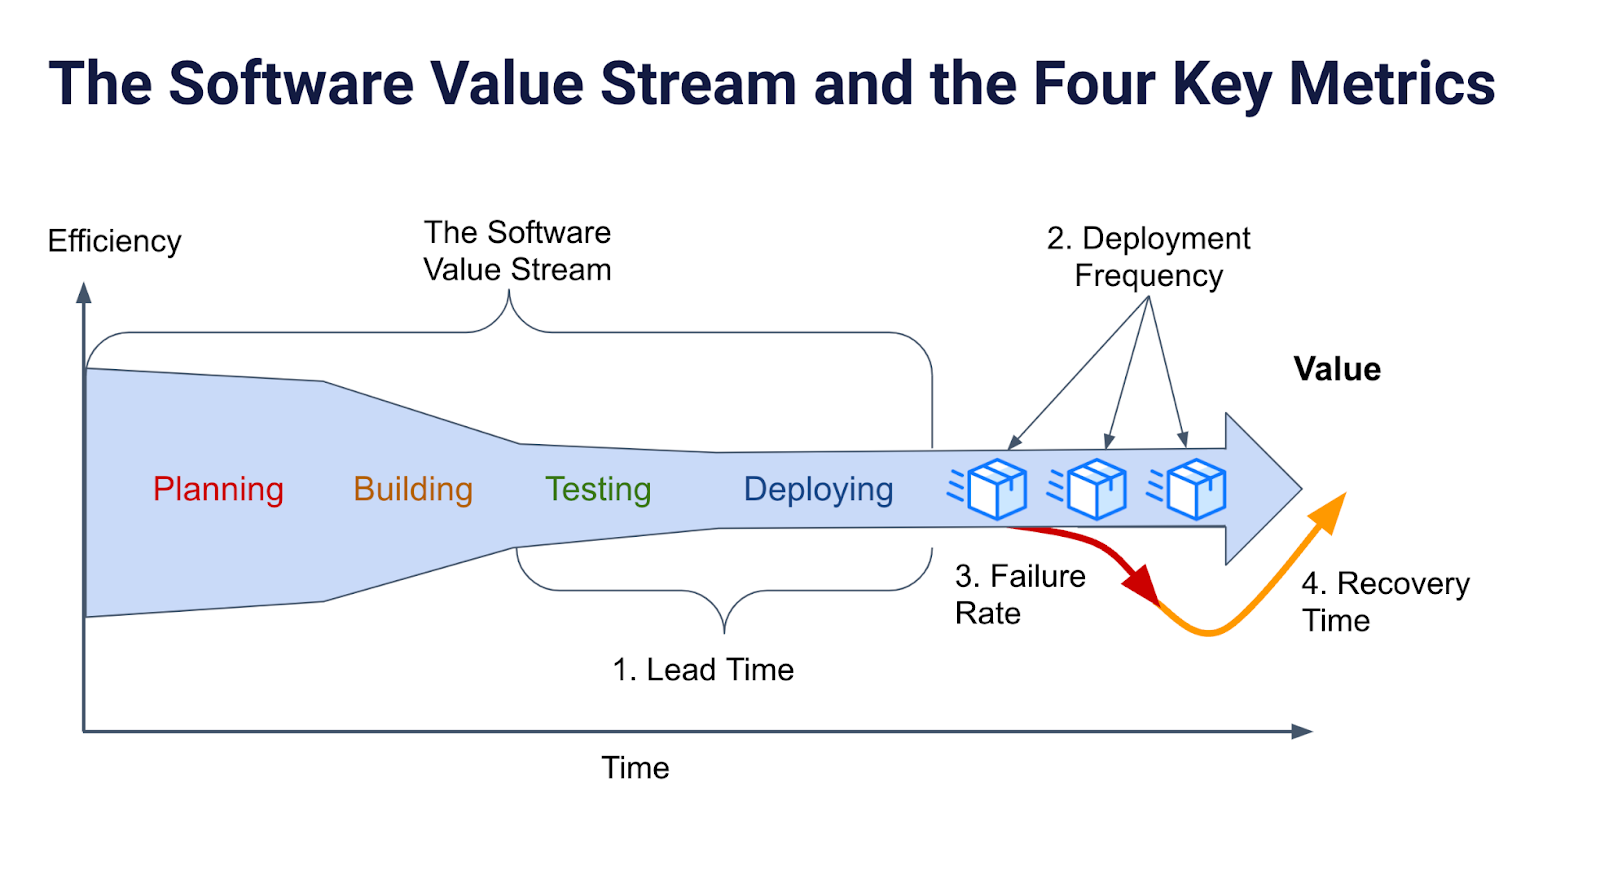
The DORA-style measures shown in the diagram are service or delivery-system metrics. They are valuable, but your initial baseline should be narrower and faster to collect:
- Time: How long does a task take from meaningful work beginning until it reaches its agreed completion boundary?
- Rework: How often, and for how long, do you have to substantially revise a first candidate?
- Defects: How often does the completed task contain a confirmed issue found during validation, review, or after release?
This baseline is not an experiment comparing “AI versus no AI.” It describes your current workflow with AI. Later, when you change one thing—such as introducing a better context packet or a stricter implementation-plan review—you can compare the new workflow against this baseline.
Measuring the productivity impact of AI coding tools - Swarmia
Read this Swarmia article section to place individual coding speed in the larger engineering flow. Its strongest practical point is that review, maintenance, and quality can absorb apparent gains at the keyboard.
In “A practical approach to measuring AI productivity impact,” read the subsection “System throughput and flow.” Follow the flow measures, especially the distinction between coding and review time. Then read “Rework and the cost of maintenance,” beginning with why rework matters. Finish with “Code quality indicators”; use the indicator list as a source of defect signals, rather than treating code-generation volume as quality evidence.
Select three task classes that you can compare honestly
A task class is not “anything I do in a Node repository.” It is a repeatable category with roughly similar scope, workflow, and completion criteria.
Choose three classes that occur frequently enough to collect at least six observations each in a fixed measurement window. Aim for 8 to 12 completed tasks per class if your workload permits. If a class occurs only once every few months, it will not yet yield a useful baseline.
For your current mix of work, a reasonable starting set might look like this:
| Task class | Example task instance | Suggested completion boundary |
|---|---|---|
| .NET API change | Add or modify a .NET endpoint, handler, validation, tests, and telemetry | PR merged with CI passing; deployment timestamp recorded separately if releases are delayed |
| Node.js integration or endpoint change | Update an endpoint, external API integration, queue consumer, or data transformation | PR merged with required tests and review completed |
| Operational configuration change | Modify an Elasticsearch query or mapping, Kubernetes manifest, Helm value, alert rule, or deployment configuration | Change approved and applied in the appropriate environment, with validation recorded |
These are examples, not mandatory categories. The key is to avoid mixing fundamentally different units. A two-line configuration correction and a cross-service .NET change should not be pooled simply because both happened in the same repository.
For each class, make a short measurement card before collecting data:
| Field | Decision to record |
|---|---|
| Unit | What counts as one task instance? |
| Start | The first substantive action: reading relevant code, investigating, prompting Claude Code, editing, or running a command |
| Done | The stable boundary for this task class, normally merged and validated |
| AI-assisted threshold | What counts as AI assistance? For example, AI produced or materially revised a plan, code, tests, query, configuration, or review analysis |
| Exclusions | Unrelated interruptions, client waiting periods, blocked credentials, or a scope change that creates a new task |
| Defect detection window | For example, until merge for pre-release defects plus 14 calendar days after deployment for escaped defects |
Use the same card throughout the window. If you redefine “done” halfway through, your before-and-after numbers will be difficult to interpret.
A practical rule for multiple gigs: keep raw data separate by client or repository. An anonymized personal sheet can use task IDs such as client-a-api-07, but do not copy proprietary prompts, source code, incident details, secrets, or customer data into a cross-client tracking document.
Define time precisely: active effort and elapsed lead time
“Time taken” sounds obvious until work is interrupted by a review queue, CI, a deployment window, another project, or a production question.
Record two time measures for every completed task:
- Active effort minutes: time you are actually investigating, prompting, editing, testing, reviewing output, fixing, or validating.
- Elapsed lead time: calendar time from the defined start to the defined done boundary.
Active effort is the closest measure of your personal capacity. Lead time captures delivery friction: review queues, CI delays, handoffs, and release processes. AI can reduce active implementation time while increasing review or repair time, so tracking only one of them can create a misleading success story.
For a solo or highly interrupted workflow, use a simple timer with five-minute rounding:
- Start it when substantive work begins.
- Pause it when you are waiting or working on unrelated work.
- Resume it only when you return to the task.
- Record waiting causes separately rather than treating them as active effort.
Use the median active time and median lead time for each task class. A median is more robust than an average when one task is delayed by an unusual incident, a difficult review, or a blocked deployment.
Do not compare the raw time of a Kubernetes operational change with that of a routine Node endpoint. Compare each class with its own future measurements.
Rework is a separate signal from time
A task may take a long time because it is inherently complex. Rework tells you something more specific: whether work had to be substantially redone after a first serious attempt met evaluation.
For this baseline, define a rework event as:
A substantive revision after the first implementation, query, configuration, or plan has been evaluated against agreed acceptance criteria.
Examples of rework include:
- A generated implementation fails relevant tests and requires a correction.
- A reviewer identifies a real design, reliability, security, or maintainability problem that causes a meaningful revision.
- An Elasticsearch query returns incorrect results and must be redesigned.
- A Kubernetes configuration passes syntax checks but fails its intended rollout or readiness behavior.
- A merged change is reverted or patched because it does not meet its intended behavior.
Do not call every edit rework. Iterating while drafting is normal engineering. A request to add a newly discovered feature is normally scope change, not rework. Record those separately so a changing ticket does not get misclassified as poor quality.
For each task, record:
- whether rework occurred;
- active minutes spent on rework;
- the main reason: test failure, review finding, wrong assumption, operational validation failure, or post-release defect;
- whether AI output was involved in the part that required revision.
Calculate both the frequency and burden of rework:
The complement of task rework rate is a useful first-pass measure:
Process Metrics | Touch Time, Lead Time, Rework, Processing Time and Cycle Time explained |
Watch “Process Metrics | Touch Time, Lead Time, Rework, Processing Time and Cycle Time explained” from A2B Thinking for a compact process-level explanation of first-pass quality and the time cost hidden inside corrective loops.
Watch first time right to see the distinction between items that complete cleanly and items that enter correction. Then skip ahead to rework time, focusing on why rework adds both hands-on effort and waiting time to total completion time.
For engineering work, the point is not to reproduce the video’s manufacturing arithmetic exactly. It is to make rework visible. If Claude Code helps you produce a first version in 20 minutes but the version triggers 90 minutes of test, review, and operational correction, the full workflow—not the first draft—is what you should optimize.
Measure defects with a consistent detection rule
A defect is not simply “a reviewer left a comment.” Nor should every stylistic preference become a quality failure.
For this baseline, count a confirmed defect when there is evidence that the task output violates an agreed requirement or engineering standard. Classify each confirmed defect by source and type.
| Source | Examples |
|---|---|
| Automated validation | New unit, integration, contract, static-analysis, security, or deployment-validation failure attributable to the change |
| Human review | A reviewer demonstrates a correctness, reliability, security, performance, or maintainability issue requiring a substantive fix |
| Post-merge or post-release | Regression, alert, incident, rollback, customer-reported issue, or follow-up bug linked to the change |
A useful minimum taxonomy is:
- Functional: behavior, validation, data handling, or API contract is wrong.
- Operational: logging, telemetry, resource behavior, rollout behavior, resilience, or performance is inadequate.
- Security or privacy: authorization, input handling, secret handling, or exposure is wrong.
- Maintainability: unnecessary duplication, confusing interfaces, unsafe complexity, or insufficient separation makes future correct change materially harder.
The last category requires discipline. “I would name this variable differently” is feedback; it is not necessarily a defect. “This naming and branching obscures an authorization branch and makes the behavior unsafe to verify” is a substantiated maintainability defect.
Does GitHub Copilot improve code quality? Here’s what the data says - The GitHub Blog
Read the methodology and code-review rubric in this GitHub Blog article as a model for separating functional checks from a consistent review standard. The lesson does not depend on its product conclusions; the useful part here is its measurement design.
Under “Methodology,” read the study design. Notice the combination of unit tests, anonymized review, and an explicit rubric. Then read “How do we define a code error?” Follow the rubric categories. Adapt only the categories that match your repositories' actual standards and reviewers' shared expectations.
Use two defect measures:
Keep pre-release defects and escaped defects separate. A test failure caught before merge is useful feedback and may create rework; an incident after release is a more serious downstream signal. Combining them destroys that distinction.
Also record the detection source. A repository with weak test coverage may appear to have fewer defects simply because it discovers fewer defects. Your baseline should describe what you can observe, not pretend detection is perfect.
Use a two-minute task log
Your log must be small enough that you will actually use it on a busy week. Create one row per completed task instance with these fields:
| Group | Fields |
|---|---|
| Identity | Task ID, date completed, task class, repository or client pseudonym |
| AI context | Tool and model, AI role such as planning, implementation, tests, debugging, or review; major workflow change noted |
| Time | Start timestamp, completion timestamp, active minutes, waiting cause if material |
| Rework | Rework occurred, rework minutes, main rework reason |
| Quality | Initial validation result, confirmed defect count, defect category, detection source, escaped defect flag |
| Scope | Small, medium, or large within the predefined task class; scope-change flag |
The AI-context fields matter because “AI-assisted” is too broad to diagnose. A task where Claude Code produced a test scaffold is not equivalent to one where it proposed the architecture, implemented it, and drafted the deployment configuration.
At the end of your fixed window, produce a summary table like this:
| Task class | Completed tasks | Median active time | Median lead time | Rework rate | Rework effort share | Defect task rate | Escaped defects |
|---|---|---|---|---|---|---|---|
| .NET API change | |||||||
| Node integration or endpoint | |||||||
| Operational configuration |
Suppose eight Node task instances show three with rework and one with a confirmed post-merge defect. The rework rate is , and the escaped-defect task rate is . Those figures do not prove that AI caused the outcomes. They tell you where to investigate: perhaps rework clusters around externally generated TypeScript schemas, unclear ticket acceptance criteria, or insufficient integration tests.
Look for patterns before reacting to totals:
- Is active implementation time falling while review or rework time rises?
- Does a particular AI role correlate with repeated test failures?
- Are defects concentrated in one task class or one scope band?
- Are operational changes producing more escaped defects than application changes?
- Did a workflow, model, repository instruction, or team review practice change during the window?
If the answer is “we do not know,” your next measurement improvement is to capture the missing context—not to make a claim from a handful of anecdotes.
Run the baseline without distorting it
For the next four weeks, or until you have at least six completed examples in each class, follow this protocol:
- Keep using AI as you normally do. Do not deliberately turn off Claude Code or invent a new prompting method yet.
- Log the task when it begins and update its row at first validation, completion, and any confirmed post-release defect.
- Preserve normal reviews, test requirements, approvals, and deployment safeguards. Faster work that bypasses validation is not a productivity gain.
- Record material changes to tool, model, repository guidance, or workflow. Treat a major change as a likely breakpoint in the data.
- Review the summary only after the predetermined window closes. Avoid changing process because of a single unusually good or bad task.
A small baseline is provisional, but it is far more useful than relying on the feeling that AI “seems faster.” It gives later workflow changes a concrete test: did time improve and did rework and defects remain acceptable?
You now have a task-level baseline that accounts for the entire path from first work to a validated outcome: active and elapsed time, substantive rework, and confirmed defects. The central habit is to keep the denominator stable—comparable completed task instances—and to make quality costs visible rather than celebrating only faster generation.
Next, you will use this baseline to create a task-to-model routing matrix. Rather than reaching for the same model and interaction style everywhere, you will choose models based on the reasoning required, context size, latency tolerance, and cost of each engineering task.
Can't find a good explanation? Sign up and we'll make it for you
Sign up