
Monitoring vs. Observability in Production Engineering
Hello, and welcome to your SRE preparation course. Over the next 12 weeks, you will build the operational judgment, hands-on observability skills, incident-response habits, and interview evidence needed for an SRE role supporting cloud-native services.
This first module establishes a reliability-engineering mindset. We begin with a distinction you will need to explain clearly in interviews: monitoring and observability are closely related, but they solve different operational problems. By the end of this lesson, you should be able to classify a production example as monitoring, observability, both, or insufficient instrumentation—and justify the classification rather than relying on buzzwords.
Monitoring detects conditions worth attention
Monitoring is the deliberate, continuous measurement of a system’s health and behavior. An engineer chooses signals that matter, visualizes them, compares them with an expected range or condition, and may trigger an alert when a condition requires action.
For a Python reservation service running on Kubernetes, common monitoring questions include:
- Is the reservation API receiving traffic?
- Is the rate of server errors rising?
- Has latency exceeded an agreed service target?
- Are pods restarting or approaching their memory limit?
- Is PostgreSQL connection usage near its configured maximum?
- Did errors begin immediately after version
2025.07.12was deployed?
These are known questions. You anticipated that the condition could be important, selected a measurement, and decided how it should be evaluated.
The Monitoring Systems with Advanced Analytics chapter from Google’s SRE Workbook gives a useful, broader definition: monitoring supports alerting, investigation, visualization, trend analysis, and comparison before and after a change. So do not say in an interview that “monitoring only alerts.” Alerting is a major use of monitoring, but dashboards and trend analysis are monitoring too.
Observability vs Monitoring - Whats the difference?
Watch “Observability vs Monitoring - Whats the difference?” by Better Stack for a concise operational framing. It emphasizes the key distinction without presenting the two practices as competing choices.
Watch monitoring basics to see how predefined measurements, dashboards, thresholds, and alerts fit together. Then watch observability context, focusing on why modern distributed systems need richer evidence to investigate a problem. The short car-dashboard analogy at the end is useful, but keep the production examples in mind: SRE work requires both early detection and effective diagnosis.
A familiar monitoring rule might be:
Page the owning team when the proportion of failed reservation-confirmation requests exceeds 2% for 10 minutes.
This is monitoring because it evaluates a preselected measurement against an explicit condition. It can be a highly valuable alert, particularly if it corresponds to real customer impact. But the alert alone does not explain which component failed, whether a rollout triggered the issue, or why a subset of reservations is affected.

Google SRE - Monitoring Systems with Advanced Analytics
Read the opening of Google’s SRE Workbook chapter “Monitoring Systems with Advanced Analytics.” It grounds monitoring in the practical activities SREs perform and distinguishes the operational strengths of metrics and logs.
In the opening “Monitoring” section, read the monitoring purposes. Note that alerting is only one purpose. Then find the “Sources of Monitoring Data” section. Read metrics and logs. Focus on the practical trade-off: metrics are generally compact and near-real-time, while structured logs preserve more detailed event context for investigation.
What monitoring is good at
Monitoring is most effective when the question and the required action are reasonably clear:
| Production need | Monitoring implementation |
|---|---|
| Detect a broad service outage | Alert on request success rate, synthetic checks, or load-balancer health |
| Detect overload | Graph and alert on queue depth, CPU throttling, memory pressure, or database connections |
| Detect an SLO threat | Alert on error-budget burn or user-visible error rate |
| Compare behavior after a release | Overlay deployment version or deployment time on latency and error graphs |
| Plan capacity | Track traffic, utilization, resource saturation, and long-term trends |
A strong monitor should lead to a useful decision. “CPU is above 80%” might be a valid warning, but it is weaker than “the reservation service is exhausting CPU, request latency is rising, and horizontal scaling is not keeping up.” Later in the course, you will design alerts around customer impact and error-budget burn rather than alerting indiscriminately on every infrastructure threshold.
Observability makes unfamiliar states explainable
Observability is a system capability: the ability to understand what is happening inside a system by examining the telemetry it emits. In operational terms, it lets you ask useful questions during an incident—even when you did not predict the exact failure mode in advance.
The important question is not merely:
Is the service unhealthy?
It is also:
Why are reservation confirmations failing only for requests routed to one region, using a newly enabled feature flag, and calling a particular restaurant-inventory partner?
That is an observability question. It requires sufficiently rich, connected telemetry to explore a situation rather than only checking a fixed set of graphs.
Read the OpenTelemetry “Observability primer” for a vendor-neutral explanation of observability and of the signals used to achieve it. OpenTelemetry is particularly relevant because its concepts transfer directly to Datadog APM and other observability platforms.
In “What is Observability?”, read the definition and instrumentation goal. Pay attention to the phrase “unknown unknowns”: problems for which you had not already created a dedicated alert or metric. Then read the full “Understanding distributed tracing” section, beginning with the tracing explanation. Focus on the relationship among logs, spans, and a distributed trace.
Observability does not mean collecting every conceivable field forever. That would create substantial cost, privacy, and usability problems. It means intentionally collecting enough trustworthy telemetry and preserving enough context to investigate meaningful system states without needing to add emergency instrumentation mid-incident.
For your future reservation-service capstone, a useful diagnostic question might be:
Are reservation confirmations slow because the API is CPU-bound, the availability service is delayed, a Redis cache is missing, PostgreSQL is blocked, or the restaurant-partner API is timing out?
A single CPU graph cannot resolve that question. Good observability lets you start with the affected request or customer journey and move through its components using connected evidence.
The signals work together; none is observability by itself
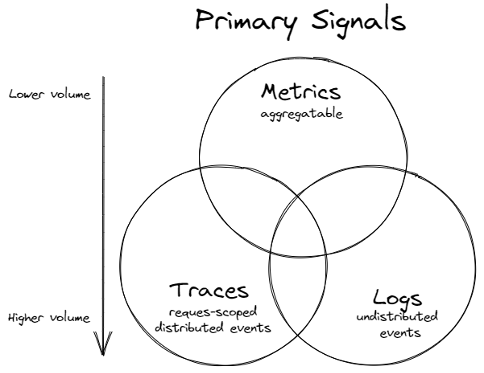
Metrics, logs, and traces are often called the three primary observability signals. They have different data shapes and answer different kinds of questions.
Metrics: “How much, how often, and how is it trending?”
A metric is a numerical measurement aggregated over time. Examples include:
- request rate by service and route;
- count of successful and failed reservation attempts;
- latency distribution for
POST /reservations; - CPU utilization and CPU throttling;
- number of active database connections;
- Celery queue depth and task failure rate.
Metrics are efficient for dashboards, alerting, SLO calculations, and long-term capacity planning. They should use bounded, intentional dimensions, such as service, environment, region, route, status_code, or version.
A metric label should generally not contain a reservation ID, email address, raw URL query, or arbitrary exception message. Those fields can have extremely many distinct values, which creates high-cardinality metric data and can make a monitoring system expensive or unreliable.
Logs: “What happened in this event?”
A log is a timestamped record of an event. A structured JSON log from a Django or FastAPI service might contain fields such as:
{
  "timestamp": "2025-07-12T12:18:04Z",
  "level": "ERROR",
  "service": "reservation-api",
  "environment": "production",
  "event": "reservation_confirmation_failed",
  "trace_id": "9ef3...",
  "reservation_id": "rsv_82a1...",
  "restaurant_id": "rest_417",
  "error_type": "PartnerTimeout",
  "dependency": "inventory-provider"
}
The log tells a detailed story about one event. It is highly useful when an alert has already indicated a problem and you need to identify error messages, affected dependency calls, rollout versions, or recurring patterns.
However, logs by themselves are not automatically observability. Unstructured, inconsistent log lines scattered across pods may contain data, but they are difficult to search, aggregate, correlate, and trust under pressure. Logging becomes much more operationally useful when it is structured, centralized, searchable, and correlated with traces.
Traces: “Where did this particular request spend time?”
A distributed trace follows one request through a system. For a restaurant reservation confirmation, a trace might contain spans for:
- the browser or mobile-client request;
- API gateway handling;
- authentication and authorization;
- reservation-service validation;
- availability-cache lookup;
- PostgreSQL transaction;
- payment or partner-inventory call;
- asynchronous notification publishing.
Each span represents a unit of work and records timing, status, and useful metadata. If a confirmation took 4 seconds, a trace can reveal whether 3.5 seconds were spent waiting for PostgreSQL, a third-party partner, or a saturated internal service.
The essential design idea is correlation:
- A metric identifies a trend or confirms customer impact.
- A trace follows an affected request across service boundaries.
- A structured log provides detailed event evidence linked by
trace_id, service name, time, and other controlled fields.
This combination makes diagnosis much faster than treating each signal as an isolated data source.
A precise distinction for interviews
A common but incomplete slogan is:
Monitoring tells you what is wrong; observability tells you why.
It is memorable, but use it carefully. Monitoring can support diagnosis, and observability platforms often include monitoring features. A better interview answer is:
Monitoring is the operational practice of measuring known health signals, visualizing them, and alerting when predefined conditions require attention. Observability is the capability to understand internal system behavior from emitted telemetry, including investigating novel or unexpected conditions. Metrics, logs, and traces are signals that support both practices. In production, monitoring detects customer-impacting conditions, while observability provides the context needed to diagnose and mitigate them.
This wording avoids two errors:
- Treating monitoring as simplistic or obsolete.
- Treating observability as a purchased tool rather than a property achieved through deliberate instrumentation, useful data design, and operational workflows.
Classifying production-engineering examples
When you see an example, classify the activity or capability, not merely the technology name. Datadog, Prometheus, Grafana, CloudWatch, Elasticsearch, and OpenTelemetry can all support monitoring and observability depending on how they are used.
Use these four categories:
- Monitoring: evaluates a known signal, displays health, tracks a trend, or alerts on a predefined condition.
- Observability: enables flexible, evidence-based exploration of system behavior, especially for unfamiliar failure modes.
- Both: monitoring provides detection while connected telemetry enables diagnosis.
- Insufficient instrumentation: data exists but is too fragmented, unstructured, or missing to reliably detect or investigate the problem.
| Example | Classification | Reasoning |
|---|---|---|
| A Kubernetes alert pages when a reservation API pod restarts five times in 10 minutes. | Monitoring | A known infrastructure condition is compared with a preset rule. |
| A dashboard graphs reservation-confirmation success rate by region, deployment version, and HTTP status. | Monitoring | It answers planned operational questions and supports comparison after changes. |
| An SLO alert says the confirmation journey is failing, then links to traces for failing requests and structured logs for the relevant dependency errors. | Both | The SLO alert detects user impact; traces and logs support diagnosis. |
| An engineer filters traces to find requests with a new feature flag, from one region, where a database span exceeded 2 seconds. | Observability | The investigation explores a specific, potentially unanticipated combination of dimensions. |
A scheduled job increments a partner_timeout_total counter; the team alerts when its rate rises. | Monitoring | A detailed event is intentionally converted into an alertable, aggregated signal. |
During an incident, responders SSH into several pods and manually search unstructured text logs with grep. | Insufficient instrumentation | There may be useful evidence, but it is neither correlated nor readily explorable under incident pressure. |
| Every application log contains a timestamp, severity, service, deployment version, request ID, and trace ID; logs are centrally searchable. | Observability-enabling capability | This creates contextual evidence and correlation, though it is not itself an alert or diagnosis. |
| A team creates a ticket automatically whenever an alert fires. | Monitoring workflow | Ticket creation routes known conditions for response; it does not add diagnostic context. |
Notice that a trace is not automatically “observability,” and a metric is not automatically “monitoring.” For example:
- A trace collected but never searchable, retained, or linked to other telemetry offers limited practical observability.
- A metric can be used for monitoring when it feeds a dashboard or alert.
- A rich, queryable metric set can also contribute to observability when it supports flexible investigation.
The distinction lies in the operational question you can answer and the evidence available to answer it.
Worked scenario: a slow reservation confirmation
Imagine that restaurant customers report that some reservation confirmations are taking more than 10 seconds. The service has not crashed. Kubernetes pods are healthy, CPU is moderate, and the overall average latency looks normal.
The monitoring view
A properly designed monitoring setup might show:
- request volume is normal;
- 5xx error rate remains low;
POST /reservationsP95 latency has increased;- only one region is affected;
- the timing coincides with a deployment of a new availability-check feature.
This is already valuable. It tells the on-call engineer that there is a customer-impacting latency issue, its scope, and a possible trigger. It also highlights why relying only on averages is risky: a small set of very slow requests can leave average latency apparently healthy.
The observability view
Now the engineer filters traces for slow confirmations in that region, during the deployment window. The traces show that most time is spent in an availability-service call. Its child span shows a slow PostgreSQL query. Linked logs show the query uses a newly introduced feature-filtering path.
The team has moved from:
- “Some users see slow confirmations.”
to an evidence-supported explanation:
- “The new availability feature produces an inefficient database query for a particular restaurant configuration in one region.”
That second conclusion is possible because telemetry preserves request context, cross-service timing, and detailed event information. The alert may have been monitoring; the successful investigation demonstrates observability.
A reliable SRE workflow uses both:
- Monitor customer-facing health and known resource constraints.
- Alert when timely attention is required.
- Use connected metrics, traces, and logs to investigate scope, likely cause, and mitigation.
- Improve instrumentation if the investigation exposed a genuine blind spot.
A quick classification method
When an interviewer gives you a production scenario, reason aloud with these questions:
-
What is the purpose?
Is the activity detecting, alerting, visualizing, investigating, or all of these? -
Is the question predetermined?
“Alert when error rate exceeds 2%” is monitoring. “Which uncommon combination of dependency, version, route, and region explains failures?” requires observability. -
What telemetry is available?
Metrics show aggregate health; logs show events; traces show request paths and timing. Determine whether the data has enough context and correlation. -
Can an engineer investigate without adding emergency instrumentation?
If yes, the system has meaningful observability for that class of failure. If no, it may have monitoring but a diagnostic blind spot. -
What action follows?
A page, ticket, rollback decision, scale-out, dependency failover, or escalation indicates the operational value of the setup.
This is a more credible approach than declaring that all dashboards are monitoring and all traces are observability.
Key takeaways
- Monitoring measures known health signals, supports dashboards and trend analysis, and alerts on predefined conditions.
- Observability is the capability to explain internal behavior from emitted telemetry, including unfamiliar failures.
- Metrics, structured logs, and distributed traces are complementary signals; no signal is inherently limited to one practice.
- Customer-impacting detection usually begins with monitoring. Rapid, confident diagnosis depends on observability.
- In interviews, avoid presenting monitoring and observability as alternatives. Explain how they work together in an incident workflow.
- For a microservice-based reservation platform, high-quality correlation among service, environment, deployment version, trace ID, and carefully chosen request attributes is central to effective diagnosis.
Next, you will turn a customer-facing restaurant reservation journey into explicit reliability requirements. That shift—from system components to what customers actually experience—is the basis for meaningful SLIs, SLOs, dashboards, and alerts later in the course.
Can't find a good explanation? Sign up and we'll make it for you
Sign up