
Hello again. In our previous lesson, we configured our project's dependencies by harnessing Bun's high-speed package manager. With grammY now part of our toolkit, we are getting closer to writing actual bot logic.
This lesson focuses on the crucial next step: executing and iterating on our code. We will explore how Bun streamlines the development loop by allowing you to run and debug TypeScript files directly, without cumbersome build steps. You'll learn how to leverage Bun's built-in runtime, watch mode, and debugger to create a fluid and efficient coding experience. Mastering this fast feedback cycle is fundamental to productive development, something you've surely honed over your years as a developer.
1. Running TypeScript Natively
One of Bun's most significant advantages is its ability to run TypeScript (and JSX) files out of the box. As a seasoned TypeScript developer, you'll appreciate that this eliminates the need for tools like ts-node or setting up complex tsconfig.json compilation pipelines just to execute a script. Bun's internal transpiler, written in the high-performance language Zig, handles this on the fly.
The command is simple and intuitive.
The official documentation provides a clear guide on how to execute files.
Start by reading the section Run a file. This introduces the basic bun run command and its shorthand. Then, look at the Examples section at the bottom for a concise summary.
To see this in action, the "Bun Crash Course" by Traversy Media provides a quick demonstration.
Bun Crash Course | JavaScript Runtime, Bundler & Transpiler
This short clip shows the bun run command being used on a TypeScript file.
Watch from this segment to see how to execute an index.ts file. Note the point made about needing to include the file extension.
Hands-on: Your First Execution
- In your project's root directory, create a file named
index.ts. - Add the following code to it. We'll import
grammYjust to confirm it's accessible.import { Bot } from "grammy"; console.log("Hello from Bun!"); console.log("grammY has been imported successfully."); - Now, run it from your terminal:
You should see the two log messages printed to your console almost instantly. You can also use the shorthandbun run index.tsbun index.ts.
2. Fast Iteration with Watch Mode
To avoid manually re-running your script after every change, Bun includes a built-in watch mode. This feature, which replaces external tools like nodemon, monitors your files for changes and automatically restarts the process.
Bun Crash Course | JavaScript Runtime, Bundler & Transpiler
The Traversy Media course effectively demonstrates this feature.
Watch the section on watch mode, from this clip. It clearly shows how the --watch flag enables automatic server restarts upon file changes.
You can also add start and dev scripts to your package.json to formalize these commands, a practice you're likely very familiar with from your work with Node.js and npm.
The documentation explains how bun run is used for package scripts.
Read the section on package scripts. This shows how to define and execute scripts, drawing a direct parallel to npm run.
Hands-on: Automating Your Workflow
- Open your
package.jsonfile and add ascriptssection:"scripts": { "start": "bun index.ts", "dev": "bun --watch index.ts" }, - Now, start your script in development mode:
bun run dev - With the script running, open
index.tsand change theconsole.logmessage. As soon as you save the file, you'll see Bun restart the process and print the new message. - You can stop the process with
Ctrl+C.
3. Debugging Your Code
When console.log isn't enough, you need a proper debugger. Bun integrates with the standard WebKit/V8 Inspector protocol, allowing you to use familiar tools like the Chrome DevTools interface or, more powerfully, the integrated VS Code debugger.
The Debugger Flags
To start a process in debug mode, you use one of the --inspect flags.
The official documentation covers the essential flags for enabling the debugger.
Review the three primary flags described at the start of the document: --inspect, --inspect-brk, and --inspect-wait. Understanding the difference between them is key: --inspect: Starts the process and the debugger. Code runs immediately. --inspect-brk: Pauses execution on the very first line, waiting for the debugger to connect. This is useful for debugging issues that happen at startup. --inspect-wait: Starts the process but waits for a debugger to connect before executing any code.
When you run with one of these flags, Bun prints a ws:// URL to the console. You can connect a debugger client to this endpoint. Bun provides a convenient web-based client at debug.bun.sh for quick debugging sessions.
Integrated Debugging in VS Code
For a seamless experience, you can configure VS Code to launch and attach its debugger directly to your Bun process. This allows you to set breakpoints, inspect variables, and step through code right within your editor.
Hands-on: Setting Up the VS Code Debugger
-
In your project, go to the "Run and Debug" panel (the bug icon in the activity bar).
-
Click "create a launch.json file" and select "Node.js" as the environment. VS Code will create a
.vscode/launch.jsonfile. -
Replace the contents of this file with the following configuration:
{
  "version": "0.2.0",
  "configurations": [
    {
      "name": "Debug with Bun",
      "type": "node", // The 'node' type works with Bun's inspector protocol
      "request": "launch",
      "runtimeExecutable": "bun", // Tells VS Code to use 'bun' instead of 'node'
      "runtimeArgs": ["${file}"], // The file to run
      "program": "${file}", // Ensures breakpoints in the current file are hit
      "outputCapture": "std",
      "internalConsoleOptions": "openOnSessionStart"
    }
  ]
}
This configuration tells VS Code's debugger to use
bunas the runtime executable. -
Now, open your
index.tsfile. -
Click in the gutter to the left of the line numbers to set a breakpoint on one of the
console.loglines. A red dot will appear. -
Press
F5(or click the green "play" button in the "Run and Debug" panel) to start debugging. -
The program execution will pause at your breakpoint. You can now inspect variables in the "VARIABLES" panel, use the Debug Console to evaluate expressions, and use the controls to step through your code.
This integrated debugging setup is an indispensable tool for developing complex applications like a Telegram bot. The Bun ecosystem's excellent integration with VS Code is one of its strong points.
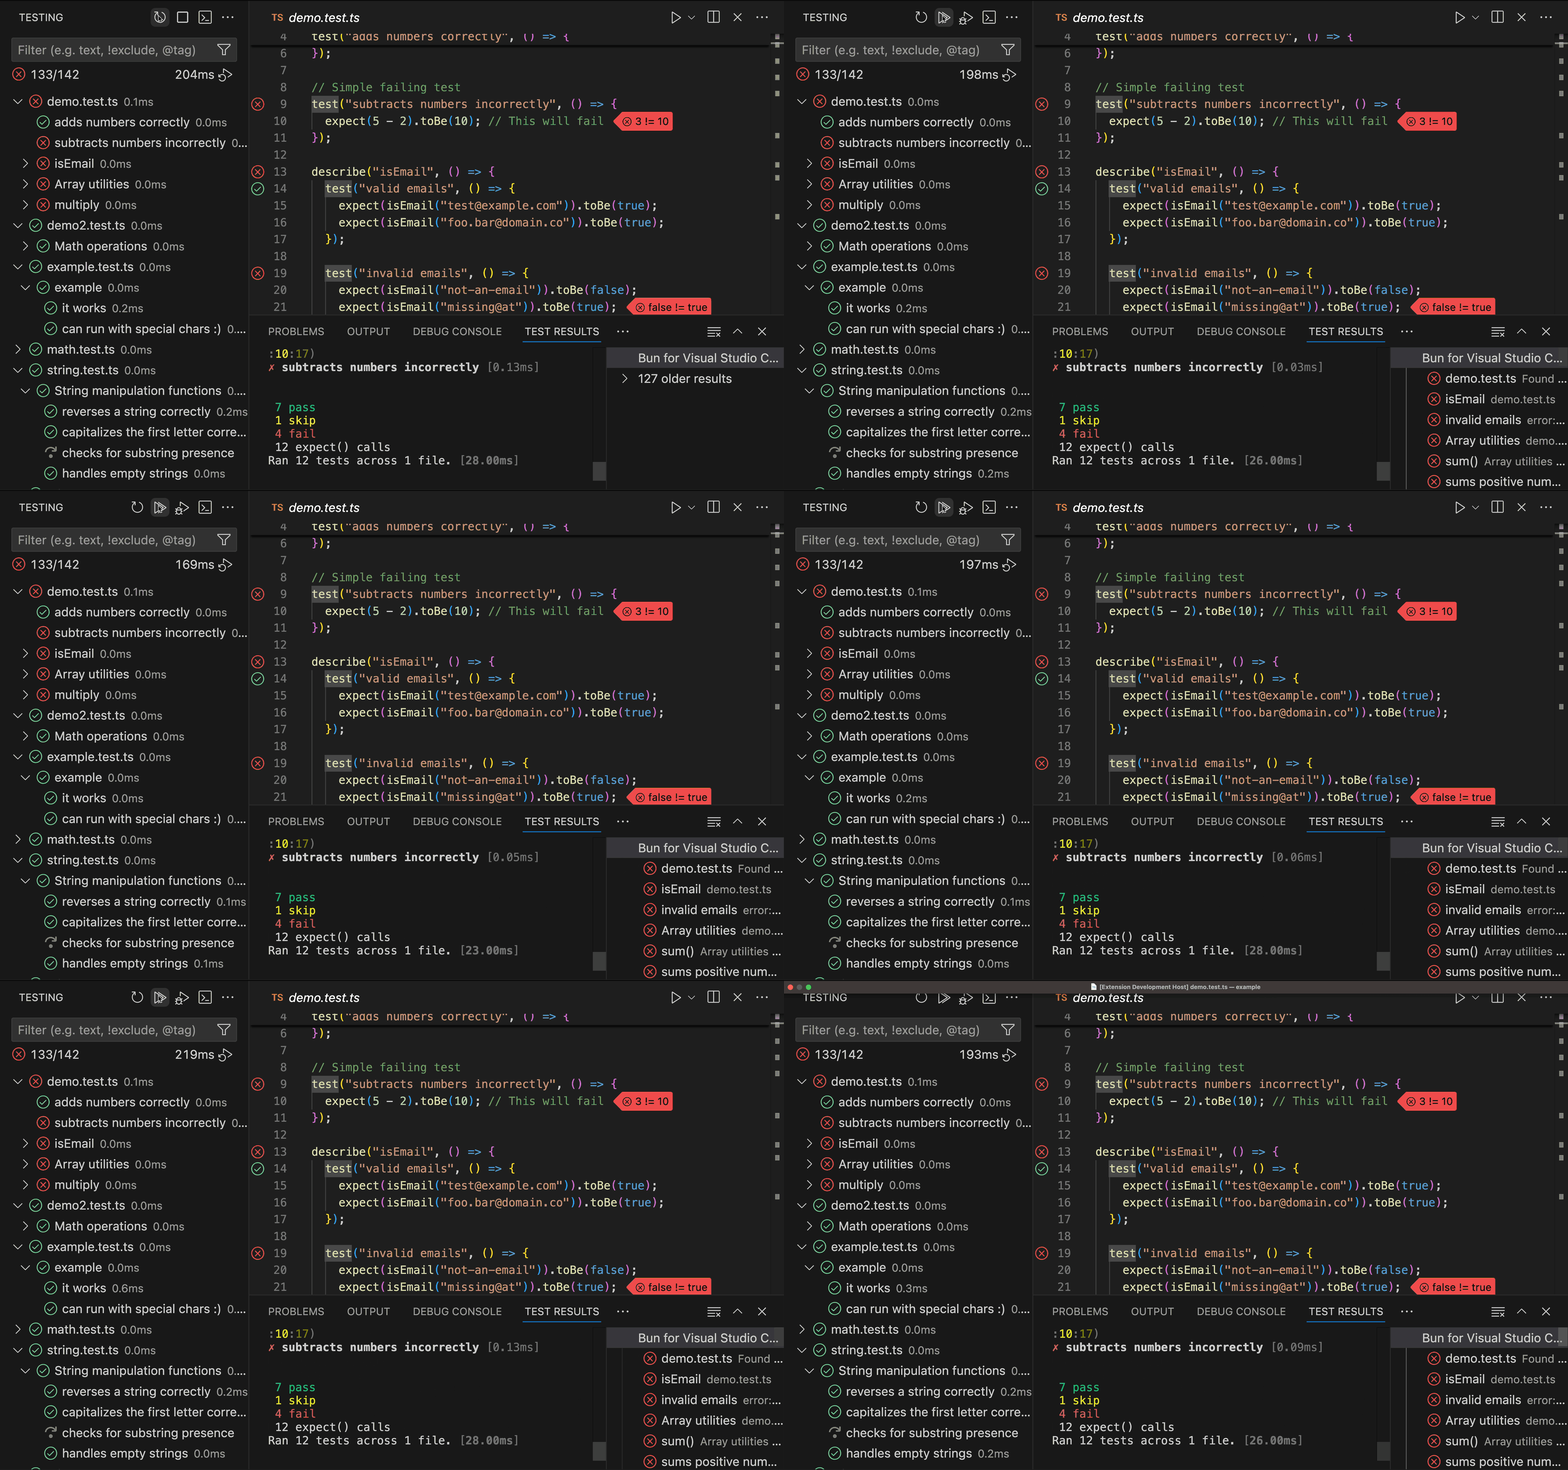
4. An Alternative: Interactive Worksheets
For more exploratory coding or quickly testing an idea without a formal debug session, you can use tools that provide a "worksheet" experience, giving you instant feedback inside your editor. A great example is the "TypeScript Worksheet" extension for VS Code, which explicitly supports Bun as a runtime.
This tool can feel like a super-powered REPL and is excellent for understanding how a specific function or API call behaves.
This NEW VSCode Extension Every TypeScript Developer Needs To Try - Full Node, Deno and Bun Support
This video introduces the TypeScript Worksheet extension and shows how to use it with Bun.
First, watch the introduction to understand the concept of an in-editor worksheet from the start. Then, see how it's installed and used for basic evaluation in the segment from this section. Most importantly, watch the clip from the section on multiple runtimes, which demonstrates how to switch the runtime to Bun and execute Bun-specific APIs like Bun.fetch.
This is an optional but powerful tool you might find enhances your workflow, especially when experimenting with new libraries or APIs.
Conclusion
In this lesson, you've established a complete, efficient run-debug cycle for your TypeScript project using Bun. You've moved from simply managing packages to actively executing and inspecting your code, leveraging Bun's native capabilities to maintain a high-velocity workflow.
Key Takeaways:
- Bun executes TypeScript files directly with
bun run <file.ts>or thebun <file.ts>shorthand, no pre-compilation needed. - The
--watchflag provides an integrated, fast file watcher that replaces tools likenodemon. - You can define and run familiar
package.jsonscripts withbun run <script>. - Bun's debugger uses the
--inspectfamily of flags and is fully compatible with the VS Code debugger via a simplelaunch.jsonconfiguration.
With a solid development and debugging workflow in place, we are now ready to handle the final piece of our project setup: configuration. In the next lesson, we will explore Bun's built-in support for .env files, which will allow us to securely manage our Telegram bot's API token and other settings.
Can't find a good explanation? Sign up and we'll make it for you
Sign up