
Hello! Welcome to the next lesson in our module on Auditing and Optimizing Solana Programs.
In the previous lesson, we focused on building secure programs by leveraging Anchor's powerful declarative constraints like init, has_one, and close. We learned how to proactively prevent common vulnerabilities such as re-initialization and type confusion attacks right at the boundary of our instructions.
Today, we shift our focus from security to performance. A program that is perfectly secure but too slow or expensive to execute will struggle to find users. The key to performance on Solana is managing Compute Units (CUs). Your learning outcome for this lesson is to measure the compute unit consumption of a program's instructions. We'll explore what CUs are, why they're critical, and two practical methods for measuring them: a high-level approach for entire instructions and a granular technique for pinpointing costly code blocks.
1. What are Compute Units and Why Do They Matter?
On Solana, every operation a program performs—from simple arithmetic to complex cryptographic calculations—consumes Compute Units. Think of it as a "computational budget" for your transaction.
To get a foundational understanding of CUs and their role, let's start with a short reading.
Introduction to Solana Compute Units and Transaction Fees
The article 'Introduction to Solana Compute Units and Transaction Fees' from RareSkills provides an excellent overview. It explains what CUs are, contrasts them with Ethereum's gas model, and clarifies their relationship with transaction fees.
Please read the following sections: The introduction (first three paragraphs). The section titled 'Compute unit optimization'. The section beginning with 'Back to compute unit. So, why would we want to optimize compute units...'. Focus on understanding the difference between CUs and fees, the default transaction CU limit, and the three key reasons for optimizing CU usage.
As the article highlighted, there are three critical reasons to care about your program's CU consumption:
- Future Fee Markets: While base fees are currently tied to signatures, Solana's fee market is evolving. Priority fees are based on CUs, and future changes will likely make CU consumption a more direct factor in transaction costs.
- Block Inclusion: During periods of high network traffic, validators prioritize transactions that are more profitable to include in a block. Lower CU transactions (especially when paired with a priority fee) are more likely to be processed quickly.
- Composability: When another program calls yours via a Cross-Program Invocation (CPI), they share a single transaction's CU budget. A "gas-guzzling" program is a poor neighbor and less likely to be integrated by other developers, limiting its utility.
2. Measuring Total Instruction CU Consumption
The simplest way to measure CU consumption is to look at the total CUs used by an entire instruction. You can do this by running a test and observing the transaction logs from the local validator.
The same RareSkills article provides a perfect hands-on walkthrough of this process. It shows how to build a minimal Anchor program, write a test for it, and find the CU consumption in the log output.
Introduction to Solana Compute Units and Transaction Fees
Let's continue with the RareSkills article to see a practical demonstration of measuring CUs.
Please read the sections starting from the first Rust code block (use anchor_lang::prelude::*;) down to just before the heading 'Smaller integers save compute units'. Follow the example to see: How the solana logs command displays the CU consumption for an instruction. How adding simple logic (pushing to a Vec) increases the CUs consumed, while the base fee remains unchanged.
This method gives you a high-level view: "My initialize instruction cost 593 CUs." It's excellent for baseline measurements and for comparing the overall cost of different instructions. However, when an instruction becomes complex, you need a more precise tool to find out where within that instruction the CUs are being spent.
3. Granular Measurement with the compute_fn! Macro
For fine-grained analysis, the Solana program library provides a handy macro called compute_fn!. You can wrap any block of code with this macro to log the CU usage of just that specific part. This is the developer's equivalent of a profiler, allowing you to pinpoint performance bottlenecks inside your functions.
Let's explore how to use it.
How to Optimize Compute Usage on Solana
The official Solana developer guide, 'How to Optimize Compute Usage on Solana', explains the compute_fn! macro and its usage.
Please read the section 'How to Measure Compute Usage'. Focus on the syntax of the compute_fn! macro. Note that the article links to a GitHub repository with a full working example, which is a great resource for further exploration.
The syntax is straightforward:
use solana_program::log::sol_log_compute_units;

// Or if you want the macro version
// use solana_program::compute_fn;

// ... inside your instruction function ...

sol_log_compute_units(); // Log CUs before the operation

// The code you want to measure
let mut a: Vec<u64> = Vec::new();
a.push(1);

sol_log_compute_units(); // Log CUs after the operation
The compute_fn! macro from the article is a convenient wrapper around this sol_log_compute_units() function. When you run your tests with solana logs active, you'll see output that looks something like this:

With this tool, you can start to answer questions like, "Is my deserialization logic more expensive than my PDA validation?" or "How much does this loop really cost?"
Test your understanding!
You have an Anchor instruction that performs three main tasks:
- It deserializes user input.
- It runs a complex calculation in a
forloop. - It serializes the result back into an account.
You suspect the for loop is the most CU-intensive part. How would you use the methods from this lesson to confirm your suspicion and quantify the cost?
Show answer
You would use a two-step approach:
- Get the total cost: Run your
anchor testand watch thesolana logsto find the total CU consumed by the entire instruction. This gives you your baseline. - Isolate the loop: In your instruction's Rust code, wrap the
forloop with thecompute_fn!macro (orsol_log_compute_units()calls before and after the loop).
By comparing the CUs consumed by the loop (from compute_fn!) to the total instruction CUs (from the logs), you can calculate the exact percentage of the budget that the loop is using. This confirms whether it's the bottleneck and is the first step toward optimizing it.
What to Measure: A Preview of Optimization
Now that you know how to measure, it's worth seeing a few examples of what you'll be looking for. The next lesson is dedicated to optimization, but seeing the impact of different code patterns will solidify why measurement is so vital.
The code we write can have drastically different CU costs based on small choices.
- Logging: Simple
msg!macros can be surprisingly expensive, especially with operations like Base58 encoding. - Data Types: Using a
u64where au8would suffice costs more compute. - Serialization: The way you serialize and deserialize account data has a huge impact. Zero-copy deserialization is far more efficient than Borsh.
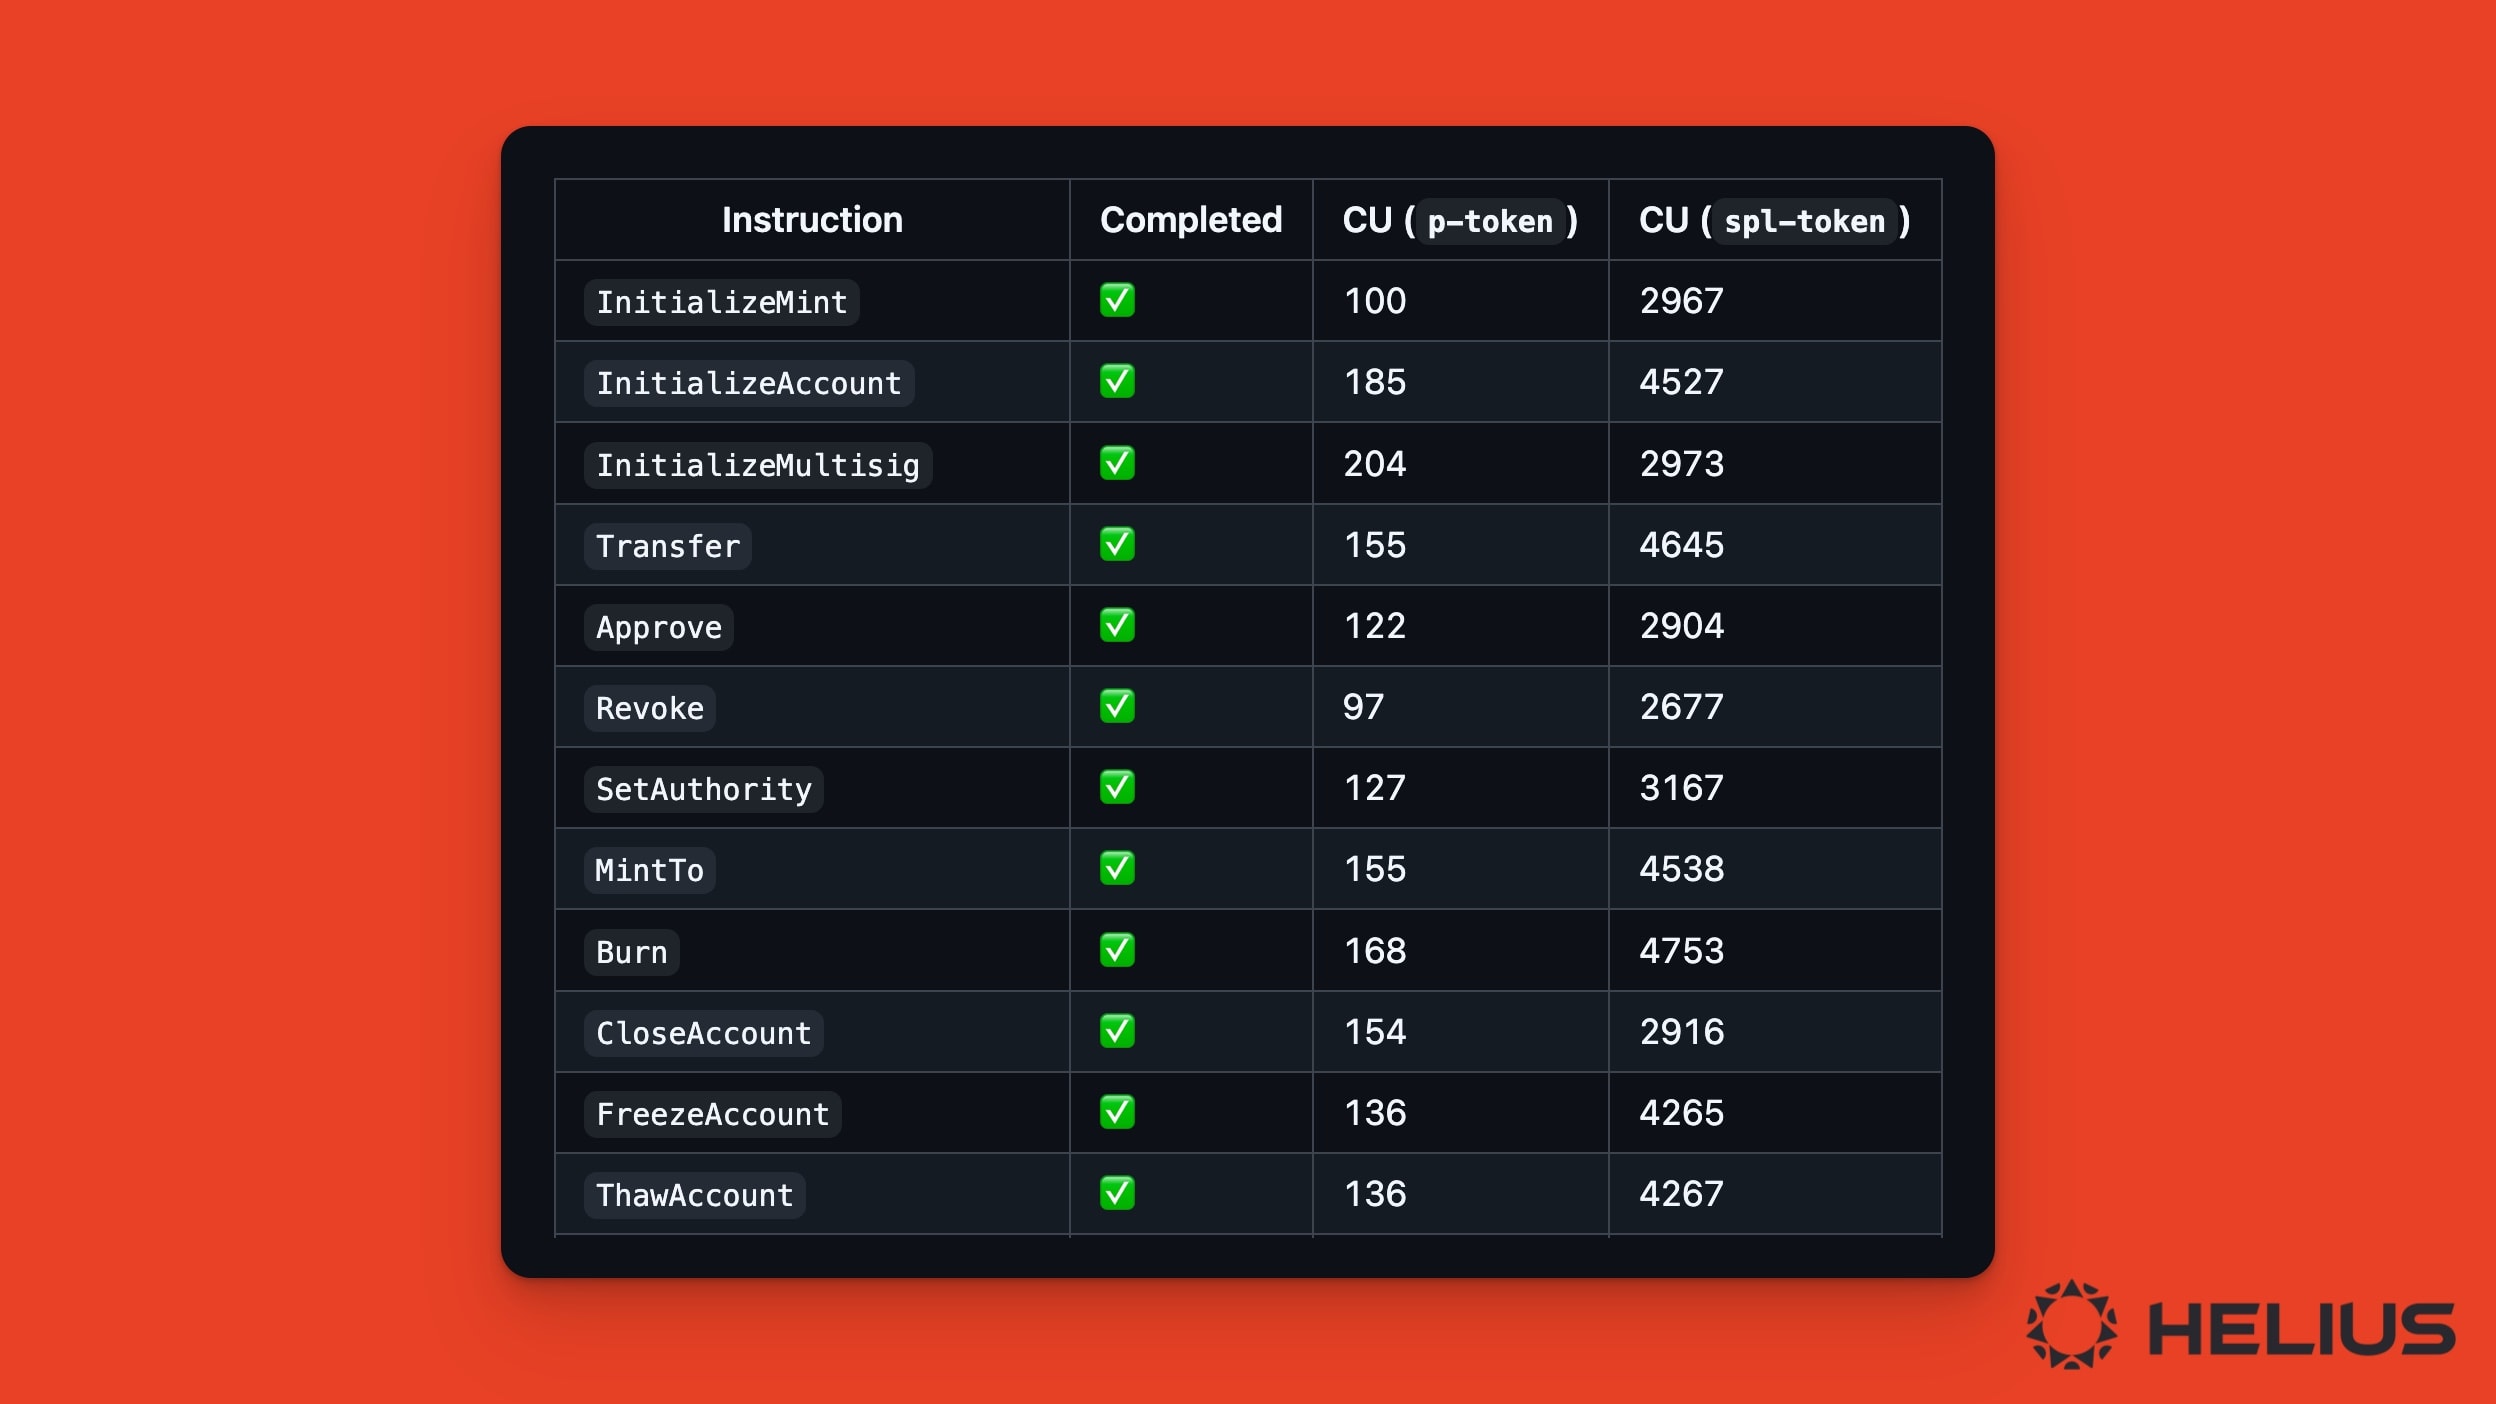
This image demonstrates that the architectural and implementation choices can lead to order-of-magnitude differences in CU consumption. Being able to measure this is the first and most crucial step in building efficient programs.
Conclusion
In this lesson, we explored the "what, why, and how" of measuring Compute Units on Solana. This skill is the foundation of performance optimization, enabling you to build programs that are not only correct and secure but also efficient and cost-effective.
Key Takeaways:
- Compute Units (CUs) are the measure of computational work for a Solana transaction. Managing them is key for performance, cost, and composability.
- You can measure the total CU cost of an instruction by running
anchor testand observing the output ofsolana logs. - You can perform granular measurement of specific code blocks using the
compute_fn!macro orsol_log_compute_units()function to pinpoint performance bottlenecks. - Code patterns related to data types, logging, and serialization have a significant impact on CU consumption.
Preview of the Next Lesson
You now have the tools to measure performance. In our next lesson, we will put them to use. We will identify and refactor high-cost operations, diving deeper into the common culprits like inefficient deserialization and excessive logging, and learn specific techniques to optimize them.
Can't find a good explanation? Sign up and we'll make it for you
Sign up