
Hello! Welcome back to our module on Observability & Monitoring.
In our last lesson, we successfully configured Prometheus to scrape metrics from our Spring Boot application and learned the fundamentals of PromQL to query that data. We can now see what is happening in our service. Today, we'll answer the question: "Is what's happening good enough?"
This lesson is crucial for your goal of acing interviews at top tech companies. We're moving beyond simple monitoring ("the CPU is at 80%") to a more sophisticated, user-centric approach to reliability pioneered by Google's Site Reliability Engineering (SRE) teams.
Our learning outcome is to define Service Level Indicators (SLIs), Objectives (SLOs), and implement alerting rules in Prometheus. By the end, you'll understand how to translate user happiness into concrete metrics and build intelligent alerts that are actionable and low-noise—a key skill for anyone running production-grade microservices.
1. The Language of Reliability: SLI, SLO, and SLA
Before we write any code, we need to establish a shared vocabulary for talking about reliability. These three acronyms—SLI, SLO, and SLA—are fundamental.
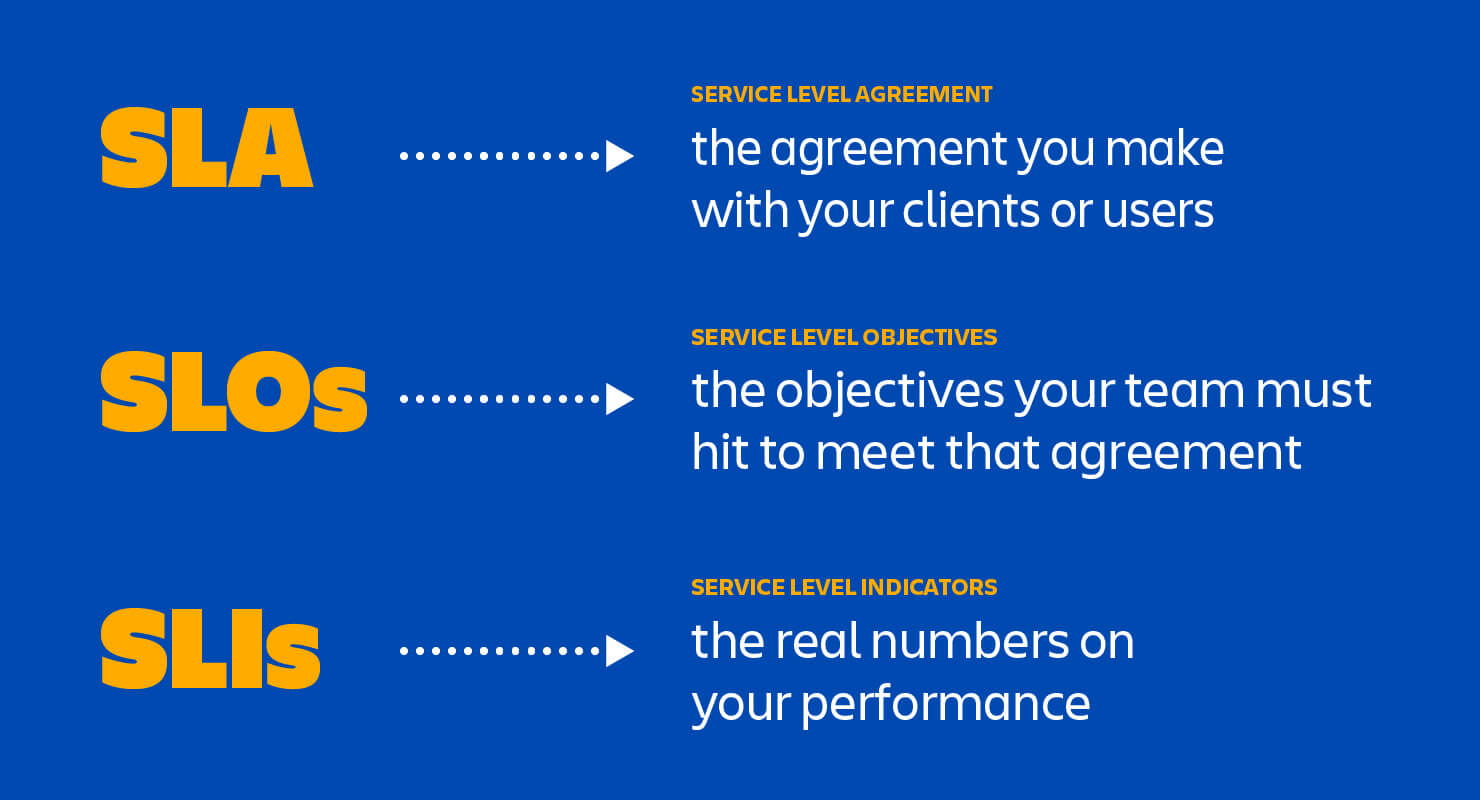
Let's dive into what each term means, as you will almost certainly be asked about them in a system design or operational interview.
A Practical Guide to SLOs and SLIs in Microservices
The following article, 'A Practical Guide to SLOs and SLIs in Microservices', provides clear and concise definitions for these core concepts. It establishes the foundation for our discussion.
Please read the section 'SLI, SLO, SLA: What’s the Difference?'. It clearly breaks down each term.
To summarize and build on this:
- Service Level Indicator (SLI): A quantitative measure of some aspect of your service. It's a metric that directly relates to user experience. An SLI is a ratio of two numbers: good events / total events.
- Service Level Objective (SLO): A target value for an SLI over a specific time window. It's your internal goal for how reliable the service should be. Example: "99.9% of requests will be successful over a rolling 28-day period."
- Service Level Agreement (SLA): A formal contract with your users that defines the consequences of failing to meet your SLOs (e.g., financial penalties, service credits). SLAs are typically business/legal documents. As engineers, our primary focus is on SLIs and SLOs to prevent SLA violations.
2. Choosing Good SLIs: Measuring What Matters
The quality of your SLOs depends entirely on the quality of your SLIs. A good SLI reflects what your users actually care about. The Google SRE book popularised a great starting point called the Four Golden Signals.
A Practical Guide to SLOs and SLIs in Microservices
The same guide provides excellent, practical advice on choosing SLIs based on the function of your microservice, grounding them in the Four Golden Signals.
Read the section 'Choosing the Right SLIs: What to Measure?'. Pay close attention to the concrete examples for different service types (user-facing vs. asynchronous).
Let's connect this to the metrics we've already seen with Micrometer and Prometheus.
-
Availability (Errors): For a REST API, this is the most common SLI. We can define it as the proportion of requests that do not return a server error (5xx status code).
- SLI Formula:
(Total Requests - 5xx Requests) / Total Requests - PromQL Implementation:
sum(rate(http_server_requests_seconds_count{status!~"5.."}[5m])) / sum(rate(http_server_requests_seconds_count[5m]))
- SLI Formula:
-
Latency: The proportion of requests that are served faster than a certain threshold.
- SLI Formula:
(Number of requests faster than X ms) / Total Requests - PromQL Implementation (using histograms):
This query calculates the percentage of requests that completed in under 500ms (sum(rate(http_server_requests_seconds_bucket{le="0.5"}[5m])) / sum(rate(http_server_requests_seconds_count[5m]))le="0.5"for 0.5 seconds).
- SLI Formula:
3. Defining SLOs and the Power of the Error Budget
Once you have an SLI, you can define an SLO. For our availability SLI, a reasonable SLO might be 99.9% (often called "three nines") over a rolling 28-day window.
Why not 100%? Striving for 100% reliability is prohibitively expensive and slows down innovation. This leads to one of the most powerful concepts in SRE: the Error Budget.
Error Budget = 100% - SLO
For a 99.9% SLO, your error budget is 0.1%. This is the amount of unreliability you are allowed over your SLO window.
- A 99.9% availability SLO over 28 days gives you an error budget of:
0.1% * 28 days * 24 hours/day * 60 minutes/hour = 40.32 minutesof total downtime.
The error budget transforms reliability from an emotional debate into a data-driven decision-making framework:
- If you have budget remaining: You are free to ship new features, perform risky maintenance, or run experiments.
- If you exhaust your budget: A feature freeze is enacted. The team's full attention shifts to improving reliability until the service is back within its SLO.
Being able to explain this trade-off and the role of an error budget is a strong signal of seniority in an interview.
4. Implementing Alerting Rules in Prometheus
Now for the practical part. How do we configure Prometheus to alert us when our SLO is at risk? A naive approach would be to alert whenever the error rate exceeds the budget.
error_rate > (1 - SLO_percentage) (e.g., error_rate > 0.1%)
This is a terrible idea. It creates "flappy" alerts that are incredibly noisy, leading to alert fatigue. A brief, 1-minute spike in errors would trigger a page, even though it consumes a tiny fraction of the monthly error budget.
The modern SRE approach is to alert on the rate of error budget consumption, or the burn rate.
Prometheus Alerting: Turn SLOs into Alerts
The Google SRE workbook offers the definitive guide on this topic. It walks through why simple alerting strategies fail and systematically builds up to the recommended best practice. This is advanced material that will set you apart.
This is the core of today's lesson. Read through the sections '1: Target Error Rate >= SLO Threshold' through '6: Multiwindow, Multi-Burn-Rate Alerts'. Understand the pros and cons of each approach and why the final strategy is the most robust.
The Multi-Window, Multi-Burn-Rate Strategy
As you read, the most effective strategy is to use multiple alerting rules to catch both fast, catastrophic failures and slow, "leaky" failures.
The key idea is to define alerts based on how quickly a problem would exhaust your entire error budget.
-
Fast-Burn Alert (High Severity - Pager): Catches critical outages.
- Condition: "Alert if the service is burning through the error budget so fast that it would be exhausted in a few hours."
- Example Rule:
Alert if 2% of the 28-day budget is consumed in 1 hour.This requires a high error rate and signals a major problem that needs immediate attention.
-
Slow-Burn Alert (Low Severity - Ticket): Catches persistent, low-level problems.
- Condition: "Alert if the service is burning through the budget at a rate that would exhaust it in a few days."
- Example Rule:
Alert if 10% of the 28-day budget is consumed in 3 days.This error rate might not be immediately obvious but will violate the SLO if left unchecked. It can be routed to a ticketing system for the team to address during business hours.
Implementing a Burn-Rate Alert Rule
Let's create a Prometheus alert rule for a fast-burn scenario. Assume a 99.9% availability SLO over a 28-day period. The error budget is 0.1%.
We want to page an engineer if 2% of this budget is consumed within 1 hour.
- Calculate the required burn rate: A 28-day window has
28 * 24 = 672hours. To burn 2% (0.02) of the budget in 1 hour, we need to be burning at a rate that is0.02 / (1 / 672) = 13.44times faster than our budget allows. This is our burn rate. - Calculate the target error rate: The allowed error rate for the whole period is
1 - 0.999 = 0.001. Our alerting threshold isburn_rate * allowed_error_rate, which is13.44 * 0.001. - Create the Prometheus Rule: Prometheus rules are defined in YAML files. Let's create
slo_rules.yml:
groups:
- name: slo_alerts
  rules:
  # Alert for high error rate on the 'user-service'
  - alert: HighErrorRate
    # The PromQL expression to evaluate
    expr: |
      sum(rate(http_server_requests_seconds_count{job="spring-boot-app", status=~"5.."}[1h]))
      /
      sum(rate(http_server_requests_seconds_count{job="spring-boot-app"}[1h]))
      > (13.44 * 0.001)
    # Wait for the condition to be true for 5 minutes before firing
    for: 5m
    labels:
      severity: page # This label can be used by Alertmanager to route the alert
    annotations:
      summary: High error rate on {{ $labels.job }}
      description: |
        The error rate for the '{{ $labels.job }}' service is over {{ $value | printf "%.2f" }}% for the last hour.
        This is consuming the error budget at an unsustainable rate.
To make Prometheus aware of this file, you would add a rule_files section to your prometheus.yml:
# prometheus.yml
global:
  scrape_interval: 15s

rule_files:
  - "slo_rules.yml" # Path to your rules file

scrape_configs:
  ... # your existing scrape configs
You would then need to restart Prometheus to load the new rules. You can check that the rules have been loaded correctly by navigating to the Alerts tab in the Prometheus UI.
Test your understanding!
You are responsible for a microservice that processes payments asynchronously from a Kafka queue. A key user journey is that payments should not be delayed.
- What would be a good SLI for this service?
- You define an SLO that 99.5% of messages must be processed within 60 seconds of being enqueued. How would you calculate your error budget over a 30-day period in terms of allowed "slow messages"?
Show answer
-
A good SLI would be processing freshness. Specifically, the proportion of messages processed within a certain time threshold from their creation.
- SLI Formula:
(Number of messages processed within 60s) / (Total messages processed)
- SLI Formula:
-
The error budget is
100% - 99.5% = 0.5%. This means you are allowed for 0.5% of your messages to take longer than 60 seconds to process over the 30-day window. If your service processes 1 million messages in that period, your error budget is0.005 * 1,000,000 = 5,000slow messages.
Conclusion
Today, you've learned a powerful, modern framework for defining and managing the reliability of your microservices. This approach is highly valued because it directly connects system performance to business and user outcomes.
Key Takeaways:
- SLIs are quantitative measures of user happiness (e.g., availability, latency).
- SLOs are the internal targets you set for your SLIs (e.g., 99.9% availability over 28 days).
- The Error Budget (
100% - SLO) is your permission to take risks and provides a data-driven framework for balancing feature velocity with reliability work. - Alerting on Burn Rate is the best practice for SLO-based alerting. It is more precise and less noisy than simple threshold alerts. It allows you to create multi-level alerts (e.g., fast-burn for pages, slow-burn for tickets).
Next Up
An alert has fired! You've been paged because your service is burning through its error budget at an alarming rate. You know what is wrong (the error rate is high), but you don't know why. Is it a database problem? A slow downstream service? In our next lesson, we will tackle this exact problem by learning how to interpret distributed traces in Zipkin to identify and diagnose performance bottlenecks in a request flow.
Can't find a good explanation? Sign up and we'll make it for you
Sign up