
Hello! Welcome back to our module on Observability & Monitoring.
In our previous lesson, we established a solid foundation for troubleshooting by implementing structured logging with correlation IDs. You learned how to tie together log entries for a single request, turning a chaotic stream of text into a searchable narrative. This is an essential skill, but it's largely a manual process of filtering and piecing together clues.
Today, we're going to automate and elevate that process. Our learning outcome is to implement distributed tracing using Micrometer Tracing and Zipkin to track requests across services. We will move beyond text-based logs to a rich, visual representation of a request's journey. You'll see exactly which services were called, in what order, and—most importantly—where time was spent. This is a non-negotiable skill for diagnosing latency and failures in production microservices, and a topic you can expect to discuss in depth during senior-level interviews.
1. From Logs to Traces: The "Why" of Distributed Tracing
While structured logging with correlation IDs allows you to find all the events related to a request, distributed tracing allows you to understand their relationship and timing.
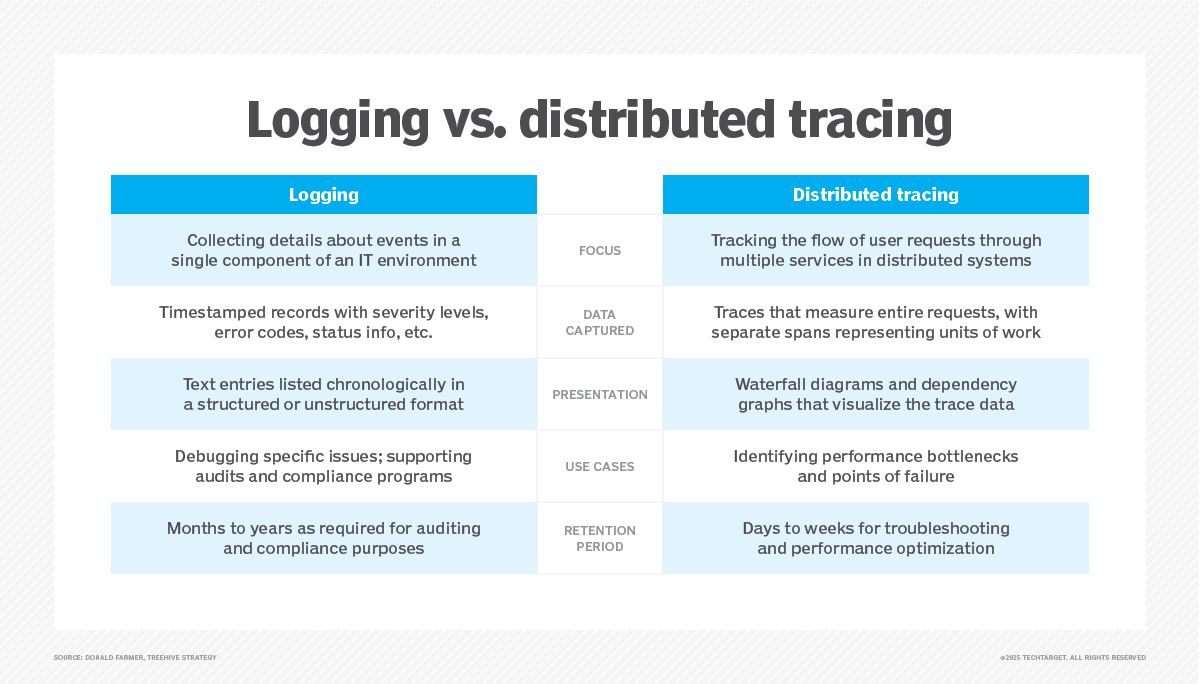
As the table shows, tracing is purpose-built for answering questions about performance and request flow in a distributed system:
- Which service is the bottleneck in a slow request?
- What is the complete call graph for a user operation?
- Are there unexpected parallel calls or serialization issues?
To answer these, we use a few key concepts:
- Trace: The entire journey of a request, identified by a
traceId. This is conceptually the same as thecorrelationIdfrom our last lesson. - Span: A single named, timed operation within a trace, like an HTTP call or a database query. Each span has a
spanIdand a reference to its parent span. A trace is a tree of spans. - Tracing Backend: A system like Zipkin or Jaeger that receives trace data from your services, reconstructs the traces, and provides a UI to visualize and query them.
2. The Modern Toolset: Micrometer Tracing and OpenTelemetry
In the past, you might have used Spring Cloud Sleuth for tracing. However, since Spring Boot 3, the landscape has changed. The new standard is Micrometer Tracing.
Similar to how SLF4J acts as a facade for logging libraries like Logback, Micrometer Tracing acts as a facade for tracer libraries. This allows you to write instrumentation code against the Micrometer API and then plug in a tracer implementation underneath. The two main implementations are:
- OpenTelemetry (OTel): A vendor-neutral, open-standard project for telemetry data. This is the modern, recommended choice.
- Brave: The library created by the Zipkin team.
In this lesson, we will use the Micrometer Tracing facade with the OpenTelemetry bridge to send data to a Zipkin backend. This combination gives you the modern Spring API, the industry-standard OTel implementation, and a simple, effective visualization tool.
3. Implementing Distributed Tracing: A Step-by-Step Guide
Let's add distributed tracing to a pair of microservices. We'll have order-service which calls inventory-service. The goal is to see a single trace that spans both services.
For this exercise, you'll need two separate Spring Boot applications. The following steps apply to both services.
Step 1: Add Dependencies
To your pom.xml, ensure you have the following dependencies.
<!-- Core Actuator for observability endpoints -->
<dependency>
    <groupId>org.springframework.boot</groupId>
    <artifactId>spring-boot-starter-actuator</artifactId>
</dependency>

<!-- Micrometer Tracing Bridge to OpenTelemetry -->
<dependency>
    <groupId>io.micrometer</groupId>
    <artifactId>micrometer-tracing-bridge-otel</artifactId>
</dependency>

<!-- OpenTelemetry exporter that sends data to Zipkin -->
<dependency>
    <groupId>io.opentelemetry</groupId>
    <artifactId>opentelemetry-exporter-zipkin</artifactId>
</dependency>
The official Spring Boot documentation provides a concise reference for setting up tracing. Let's review the key sections to solidify our understanding of the components and configuration.
Please read the 'Getting Started' section to see the minimal setup, and then review the 'OpenTelemetry With Zipkin' section under 'Tracer Implementations'. This will confirm the dependencies we just added and their roles.
Step 2: Configure Application Properties
In application.properties for both services, add the following configuration.
For order-service:
# Service port and name
server.port=8080
spring.application.name=order-service

# --- Tracing Configuration ---
# Send 100% of traces. Default is 0.1 (10%). Great for dev, but costly in prod.
management.tracing.sampling.probability=1.0

# Include trace and span IDs in all log messages
logging.pattern.level=%5p [${spring.application.name:},%X{traceId:-},%X{spanId:-}]
For inventory-service:
# Service port and name
server.port=8081
spring.application.name=inventory-service

# --- Tracing Configuration ---
management.tracing.sampling.probability=1.0
logging.pattern.level=%5p [${spring.application.name:},%X{traceId:-},%X{spanId:-}]
Notice the logging.pattern.level. This is the link back to our previous lesson. With micrometer-tracing on the classpath, Spring Boot automatically populates the MDC with traceId and spanId, which we can now easily include in our logs.
A Note on Sampling:
In a high-traffic production system, tracing every single request can be expensive and overwhelming. Sampling is the practice of tracing only a subset of requests.
- Head-based sampling makes the decision at the beginning of the trace. It's simple but may miss traces that only later encounter an error.
- Tail-based sampling makes the decision at the end, after all spans have been collected. This allows you to intelligently keep important traces (e.g., those with errors) but requires more infrastructure.

For an interview, being able to discuss the trade-offs between these sampling strategies demonstrates a mature understanding of production observability.
Step 3: Run Zipkin
The easiest way to run Zipkin is via Docker. Open your terminal and run:
docker run -d -p 9411:9411 openzipkin/zipkin
This will download and start the Zipkin container. You can access its UI at http://localhost:9411.
Step 4: Implement the Service-to-Service Call
Now, let's write the code.
In inventory-service, create a simple controller:
// In inventory-service
@RestController
public class InventoryController {
    @GetMapping("/inventory/{productId}")
    public boolean checkInventory(@PathVariable String productId) {
        // Simulate work
        try {
            Thread.sleep(50);
        } catch (InterruptedException e) {}
        return true;
    }
}
In order-service, we'll create a controller that calls the inventory service. The key here is how we create the RestTemplate.
// In order-service
@Configuration
public class AppConfig {
    // CRITICAL: Inject the builder to get an auto-instrumented RestTemplate
    @Bean
    public RestTemplate restTemplate(RestTemplateBuilder builder) {
        return builder.build();
    }
}

@RestController
public class OrderController {
    private final RestTemplate restTemplate;

    public OrderController(RestTemplate restTemplate) {
        this.restTemplate = restTemplate;
    }

    @GetMapping("/order/{productId}")
    public String placeOrder(@PathVariable String productId) {
        boolean inStock = restTemplate.getForObject(
            "http://localhost:8081/inventory/{productId}",
            Boolean.class,
            productId
        );
        return "Order placed for " + productId + ", in stock: " + inStock;
    }
}
This is the most important part of the implementation. By injecting and using the RestTemplateBuilder, Spring Boot automatically adds an interceptor that propagates the trace context (the traceId and spanId) in the HTTP headers of the outgoing request. If you were to create it with new RestTemplate(), tracing would not be propagated, and you would see two disconnected traces in Zipkin.
The Spring Boot documentation explicitly warns about this common pitfall. Let's quickly review it to ensure it's committed to memory.
Read the short section 'Propagating Traces'. Note that this applies to RestTemplate, RestClient, and WebClient.
4. Visualizing the Distributed Trace
With both services and Zipkin running, make a request to the order-service:curl http://localhost:8080/order/product123
Now, go to the Zipkin UI at http://localhost:9411.
- Click the "Run Query" button. You should see a trace for
order-service. - Click on the trace to see the details.
You will see a waterfall diagram showing two spans:
- The first, longer span represents the request handling in
order-service. - Nested inside it, you'll see a second, shorter span representing the call to
inventory-service.
This instantly shows you the flow and timing. If the call to inventory-service were slow, its bar would be much wider, immediately identifying it as the source of latency.
5. Custom Instrumentation with @Observed
Auto-instrumentation is great for external communication like HTTP calls, but what if you want to trace a specific piece of business logic within a method? For this, we use the @Observed annotation from Micrometer.
Let's say the placeOrder method also involves a complex calculation. We can wrap it in its own span.
First, you need to register the ObservedAspect bean in your application (this is required to enable the @Observed annotation).
// In order-service's AppConfig or another @Configuration class
@Configuration
public class AppConfig {
    //... restTemplate bean from before

    @Bean
    public ObservedAspect observedAspect(ObservationRegistry observationRegistry) {
        return new ObservedAspect(observationRegistry);
    }
}
Now, create a service method and annotate it.
// In order-service
@Service
public class OrderService {
    @Observed(name = "order.creation", contextualName = "creating-order-logic")
    public void createOrder(String productId) {
        // Simulate complex business logic
        try {
            Thread.sleep(100);
        } catch (InterruptedException e) {}
    }
}

// And update the controller to use it
@RestController
public class OrderController {
    //... constructor and restTemplate field
    private final OrderService orderService;

    // update constructor
    public OrderController(RestTemplate restTemplate, OrderService orderService) {
        this.restTemplate = restTemplate;
        this.orderService = orderService;
    }

    @GetMapping("/order/{productId}")
    public String placeOrder(@PathVariable String productId) {
        orderService.createOrder(productId); // Call the observed method

        boolean inStock = restTemplate.getForObject(
            "http://localhost:8081/inventory/{productId}",
            Boolean.class,
            productId
        );
        return "Order placed for " + productId + ", in stock: " + inStock;
    }
}
Now if you run the request again and check Zipkin, you will see a third span named creating-order-logic nested inside the order-service span. This allows you to add fine-grained performance monitoring to any part of your code.
Observability with Spring Boot 3
The Spring team wrote an excellent blog post introducing the new observability features in Spring Boot 3, including a detailed look at the Observation API and @Observed.
Please read the section 'WebMvc Server Code'. It provides a great example of using @Observed and explains what the name and contextualName attributes do. This directly maps to what we just implemented.
Test your understanding!
A developer reports that tracing works perfectly for a synchronous REST endpoint. However, when they use an @Async method to process part of the request, the logs from that async method have a different traceId, and the work doesn't appear in the Zipkin trace. What is the cause, and how do you fix it?
Show answer
The cause is that trace context, like MDC context from our previous lesson, is stored in a ThreadLocal. When an @Async method is invoked, it runs on a different thread from a thread pool, and the ThreadLocal context is not propagated by default.
The solution is the same as for MDC: you need to provide a TaskDecorator bean. Spring Boot's instrumentation will automatically wrap this decorator to propagate the active trace context from the request thread to the async thread, ensuring the trace remains contiguous.
Conclusion
Congratulations! You have successfully implemented distributed tracing, one of the most powerful tools for operating and debugging microservices. You've seen how modern Spring Boot, through Micrometer and OpenTelemetry, makes this incredibly accessible.
Key Takeaways:
- Distributed Tracing provides a visual, end-to-end timeline of a request's journey across services.
- A Trace is a tree of Spans, where each span represents a unit of work.
- Micrometer Tracing is the standard facade in Spring Boot 3+, with OpenTelemetry being the recommended underlying implementation.
- Spring Boot's auto-configuration is powerful but relies on using the provided builders (e.g.,
RestTemplateBuilder) to instrument clients. - The
@Observedannotation is the modern, idiomatic way to create custom spans for specific business logic. - Zipkin is a simple yet effective tool for collecting and visualizing traces.
Next Up
We have now covered two of the three pillars of observability: Logging and Tracing. Tracing is excellent for understanding the lifecycle of a single request ("why is this request slow?"). But what about the overall health of the system? How do we monitor trends and alert on systemic problems ("is the average request latency increasing?")?
In our next lesson, we will tackle the third pillar: Metrics. You will learn how to configure custom application metrics using Micrometer and expose them in Prometheus format, setting the stage for powerful dashboards and automated alerting.
Can't find a good explanation? Sign up and we'll make it for you
Sign up