
Clinical Laboratory Testing: A 35-Slide Guide to Methods, Interpretation, and Quality Assurance
Hello. This capstone module turns the technical material of antimicrobial susceptibility testing into a coherent 60-minute presentation for a master’s-level audience. Your constraint is useful: 35 slides is enough to show the complete specimen-to-report pathway, but only if each slide has one job and the timing reflects clinical importance rather than giving every method equal attention.
By the end of this lesson, you will have a 35-slide storyboard with exactly 60 minutes allocated across clinical context, specimen quality, workflow, conventional and automated methods, interpretation, safety, quality systems, and a laboratory discussion case. The next step will be to turn the automated-platform portion into a rigorously sourced comparison table.
Start with the presentation argument, not the instruments
A strong AST presentation should answer one central question:
How does a laboratory convert a clinically meaningful specimen into a timely, reliable, and actionable antimicrobial report?
That framing prevents a common weakness in presentations on automation: becoming a catalogue of instruments. VITEK 2, MicroScan, BD Phoenix, and MALDI-TOF matter because of where they fit in the diagnostic pathway, what result they produce, how quickly, and what must happen when the result is unsafe or implausible.
Use this three-part narrative:
-
A useful AST result begins before the laboratory.
Specimen selection, collection, transport, acceptance, isolation, culture purity, and standardized inoculum determine whether later automation has any valid input. -
Methods produce different kinds of evidence.
Conventional culture-based approaches, gradient methods, broth microdilution, automated ID–AST platforms, and MALDI-TOF differ in what they measure, their turnaround time, and their limitations. -
A result is not automatically a report.
Breakpoints, expert rules, QC, confirmation, LIS transfer, selective reporting, and urgent communication turn an analytical output into a clinically defensible report.
The WHO diagnostic-stewardship guidance is particularly useful for establishing this patient-centred story before discussing technology.
[PDF] Diagnostic stewardship - IRIS
Read the WHO guide’s account of the diagnostic pathway. It provides the clinical logic for your opening slides: correct sampling, timely processing, reliable AST, and effective communication are interdependent.
In Section 1, “The diagnostic pathway,” read Subsections 1.1–1.3 (pp. 5–8). Begin with the pathway overview, paying particular attention to sampling before therapy when feasible, complete request information, specimen-specific transport, and why delay reduces clinical value. Then read Section 1.5, “Laboratory processing and procedures” (pp. 9–10), from the laboratory role. Note the link among rejection criteria, documentation, recognized AST standards, quality management, and biosafety. Finish with Section 1.6, “Feedback and reporting of results,” especially the discussion of selective reporting and alert results.
Allocate time deliberately
An even division gives only about minutes per slide. That is a useful average, not a rule. Title and transition slides should be brief. Slides involving a clinical decision, comparison, or discussion deserve more time.
For each slide, prepare:
- a take-home message of no more than one sentence;
- one primary visual: process sketch, plate image, instrument workflow, table, or case data;
- a spoken explanation that adds interpretation rather than reading the slide;
- a short source citation in the footer, with full references in speaker notes or a handout.
Do not put a complete SOP, a dense breakpoint table, or a manufacturer brochure screenshot on a slide. Instead, show the decision-relevant features and state that exact procedures, breakpoints, QC ranges, and panel availability must be checked in the laboratory’s current CLSI or EUCAST standard, manufacturer instructions for use, and local SOP.
A 35-slide, 60-minute storyboard
The following storyboard is designed as a complete first draft. The time column totals 60 minutes.
| Slide | Time | Slide purpose and suggested visual | Essential spoken point |
|---|---|---|---|
| 1. Title | 1 min | From specimen to clinically actionable AST: conventional and automated approaches. Add name, course, date. | Introduce the presentation’s central claim: reliable AST is a workflow, not merely an instrument output. |
| 2. Roadmap and learning objectives | 1 min | Show four questions: Why does AST matter? How is it performed? How is it interpreted? When must it be questioned? | Tell the audience they will follow a specimen through collection, testing, validation, reporting, and a case. |
| 3. Why timely bacterial ID and AST matter | 1.5 min | A concise clinical scenario contrasting empiric and targeted treatment. | ID and AST support appropriate therapy, de-escalation, avoidance of ineffective drugs, and recognition of resistance. |
| 4. Effects beyond the individual patient | 1.5 min | Four icons: patient outcome, stewardship, infection prevention, surveillance. | Accurate results inform treatment, antimicrobial stewardship, infection-control actions, and local resistance surveillance. |
| 5. Diagnostic stewardship: the pre-analytical foundation | 1.5 min | “Right patient, right specimen, right time, right test, right communication.” | A technically excellent method cannot rescue an irrelevant, contaminated, delayed, or poorly documented specimen. |
| 6. Specimen-to-report pathway | 1.5 min | A simple vertical workflow: collection, transport, receipt, culture, ID, AST, verification, LIS report, clinician action. | Establish the full pathway now; later slides revisit its critical control points. |
| 7. Specimen requirements and rejection criteria | 2 min | Two-column table: acceptable versus reject or query. Include identity, correct container, sufficient volume, transport time, leakage, and labeling. | Rejection criteria protect staff and prevent unreliable results; rejection must be documented and communicated promptly. |
| 8. Specimen-specific risks | 2 min | Four tiles: blood, urine, stool, genital/other fastidious specimens. | Emphasize contamination risk, collection technique, container/transport medium, and storage conditions. Avoid presenting generic rules as universal. |
| 9. Culture-based laboratory workflow | 2 min | Bench workflow showing Gram stain or preliminary information, primary culture, colony selection, ID, AST, review, report. | Culture remains central because phenotypic AST generally requires viable, isolated organisms. |
| 10. Culture purity and colony selection | 1.5 min | A plate with two colony morphologies contrasted with a pure culture. | Automated testing must begin from an appropriate pure isolate. Mixed cultures can produce misleading ID–AST combinations. |
| 11. Standardized inoculum: a hidden determinant | 2 min | Schematic of selecting colonies, suspending in saline or broth, and measuring turbidity. | Inoculum density, colony age, medium, delay, and incubation conditions can shift growth detection and MIC results. |
| 12. MIC: from growth pattern to clinical category | 2 min | A simple broth microdilution row with growth and no-growth wells. | The MIC is the lowest concentration inhibiting visible growth under defined conditions; it becomes clinically meaningful only after interpretation against an appropriate breakpoint. |
| 13. The AST-method landscape | 1.5 min | Use the “Methods of antimicrobial susceptibility testing” figure below. | Use the figure as a map of phenotypic, molecular, and mass-spectrometry approaches, while stressing that turnaround time is context-dependent and that routine MALDI-TOF is principally an identification tool. |
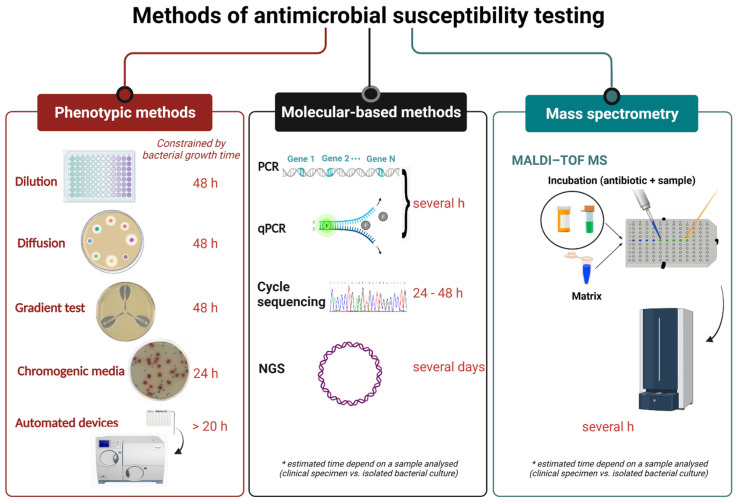
| Slide | Time | Slide purpose and suggested visual | Essential spoken point |
|---|---|---|---|
| 14. Disk diffusion: conventional phenotypic AST | 1.5 min | Annotated Mueller–Hinton plate with disks and inhibition zones. | Disk diffusion is accessible and visual, but its reliability depends on standardized medium, inoculum, disk handling, incubation, measurement, and current interpretive criteria. |
| 15. Broth microdilution and gradient diffusion | 2 min | Side-by-side image: microdilution wells and an MIC gradient strip on agar. | Broth microdilution is the reference basis for many MIC determinations; gradient strips offer flexible individual MIC testing but require careful reading and can be costly. |
| 16. What automation changes, and what it does not | 2 min | Comparison: manual work, standardization, throughput, time to result, flexibility, cost, confirmation needs. | Automation standardizes incubation, reading, data handling, and reporting, but it does not eliminate pre-analytical error, biological complexity, or the need for expert review. |
| 17. MALDI-TOF MS: rapid identification, not routine AST | 2 min | Simplified spectrum-generation and database-match diagram. | MALDI-TOF identifies organisms by matching protein spectra to a database. It usually accelerates identification; it does not replace phenotypic MIC testing in routine AST workflows. |
| 18. VITEK 2 workflow | 2 min | Suspension, card choice, loading, kinetic optical readings, software review, MIC/category output. | Explain the relationship between standardized suspension, organism/card compatibility, automated kinetic reading, expert-system review, and reported MICs. |
| 19. MicroScan WalkAway workflow | 2 min | Panel selection, inoculation, automated incubation/reading, broth microdilution output, software/LIS review. | MicroScan uses prepared microdilution panels and can deliver ID–AST information, depending on panel format and laboratory configuration. |
| 20. BD Phoenix workflow | 2 min | Panel inoculation, loading, chromogenic/fluorogenic growth detection, automated analysis, review. | Phoenix combines automated ID and AST testing in panels read repeatedly during incubation; the report still requires plausibility checks. |
| 21. Platform comparison: MALDI-TOF, VITEK 2, MicroScan, BD Phoenix | 2 min | A concise comparison table with columns: primary role, principle, output, approximate workflow time, strengths, limitations. | Make the key distinction explicit: MALDI-TOF is primarily ID-only, while VITEK 2, MicroScan, and Phoenix are integrated ID–AST systems. |
| 22. Performance and limitations of automated AST | 1.5 min | Definitions: essential agreement, categorical agreement, minor error, major error, very major error. | An automated result can be numerically close to a reference MIC but clinically misclassified near a breakpoint; resistant-as-susceptible errors are especially consequential. |
| 23. Breakpoints and result interpretation | 2 min | MIC value placed against a generic susceptible, increased-exposure/intermediate, and resistant framework. | Interpret MICs only with current organism–drug–method-specific tables. State whether CLSI or EUCAST is used and record the standard version. |
| 24. Expert systems and biological plausibility | 2 min | Example review screen with “intrinsic resistance,” “phenotype rule,” and “manual review” callouts. | Expert rules support consistency but do not substitute for microbiologist judgment. Identity, intrinsic resistance, phenotype patterns, and QC must agree. |
| 25. LIS reporting and communication | 1.5 min | A report mock-up showing organism, MIC/category, comments, selective reporting, and critical alert. | Verify transfer of ID, MICs, categories, comments, suppressed agents, and alerts. Selective reporting supports stewardship, while urgent results require direct communication. |
| 26. Biosafety across the workflow | 1.5 min | Bench safety checkpoints: receipt, vortexing/suspension, opening cultures, waste, decontamination. | Biosafety is embedded in routine work: PPE, aerosol reduction, safe handling of cultures, cleaning, waste management, and incident documentation. |
| 27. Quality system: distinguish QA from QC | 1.5 min | Nested diagram: quality system contains QA; QA contains process monitoring; QC tests run performance. | QA includes training, documentation, audits, corrective actions, maintenance, and proficiency testing. QC demonstrates that a defined test run performs within acceptable limits. |
| 28. AST QC plan | 2 min | A compact QC plan: reference strain, method/panel, frequency, acceptance range, action if failed. | Use appropriate control strains and current accepted ranges. If controls fail, determine whether patient results must be held, repeated, or investigated according to the validated policy. |
| 29. Equipment and environmental controls | 1.5 min | Checklist: calibrations, preventive maintenance, temperature monitoring, reagent lots, media checks, MALDI calibrant, documentation. | Equipment control makes analytical performance traceable. A well-designed system detects drift before it affects patient reports. |
| 30. When a result needs confirmation | 2 min | Decision table: repeat from pure culture, alternative method, reference method, molecular confirmation. | Question results when purity, ID–AST concordance, intrinsic resistance, expected phenotype, QC status, or clinical plausibility is problematic. |
| 31. Discussion case: clinical setting | 1 min | Case title and concise clinical details: septic patient, two blood-culture sets positive for Gram-negative rods, preliminary result communicated. | State that the case concerns whether an automated ID–AST result is fit for release, not simply whether the instrument generated a result. |
| 32. Discussion case: bench findings | 2 min | Culture plate illustration showing two colony morphologies; include automated result flagged as inconsistent despite in-range routine QC. | Reveal that a suspension was prepared before the mixed culture was recognized. The audience should see why valid QC does not prove a patient isolate is pure. |
| 33. Audience discussion: release, repeat, or confirm? | 4 min | Display three decisions: what to communicate now, what to do at the bench, and what must be documented. | Facilitate a structured discussion. Allow about two minutes for small-group reasoning and two minutes to collect responses. |
| 34. Case resolution | 2 min | Ordered actions: withhold original automated output; re-isolate each morphotype; repeat ID and AST from pure colonies; apply phenotype-directed confirmation if indicated; verify final LIS report. | The correct response protects the patient from a false result while still communicating time-critical preliminary information. |
| 35. Closing takeaways | 0.5 min | Five short statements, one per major theme. | End with the principle that a rapid result is clinically valuable only when the specimen, method, QC, interpretation, and reporting pathway are all reliable. |
Timing check
-
Slides 1–8: 12 minutes
Clinical relevance and specimen quality -
Slides 9–22: 24.5 minutes
Workflow, conventional methods, MALDI-TOF, automated systems, and performance -
Slides 23–30: 14 minutes
Interpretation, reporting, safety, QA/QC, equipment control, and confirmation -
Slides 31–35: 9.5 minutes
Discussion case and conclusion
Total: 60 minutes
Use sources selectively and critically
The following APEC laboratory guide can support your conventional-method, automated-system, and quality-system slides. It is a helpful methodological overview, but some examples are veterinary-oriented and several cited standards are older. Do not use it as the final authority for current human-clinical breakpoints, QC ranges, or local reporting policy.
Antimicrobial Susceptibility Testing
Read the sections on manual and commercial AST systems and on quality systems. Use them to clarify the analytical principles, advantages, practical limitations, and QC concepts behind the comparison slides.
In the section “Manual Systems,” read the gradient diffusion explanation. Use it to distinguish a gradient MIC from disk diffusion and broth microdilution. Then move to “Commercial Systems” and read the material on MicroScan and Phoenix. Focus on the MicroScan description and the Phoenix description. Extract only slide-level comparisons: principle, format, reading approach, output, and constraints. Finally, in “Quality Control,” read the QA framework. Distinguish process-level QA from run-level QC in Slides 27–29.
For the QC slides, this short segment reinforces an important presentation point: QC is not merely a pass/fail number. Trending results can reveal drift, and a failure requires disciplined investigation before results are released.
Watch “7 Quality control” by Gunnar Kahlmeter to support the reasoning behind your QC and troubleshooting slides.
Watch extended QC for the distinction between routine susceptible control strains and resistance-mechanism controls, and for the value of trend review. Then watch error sources to connect out-of-range QC to disks, media, agar depth, inoculum, incubation, and strain handling. Convert these into a concise investigation checklist rather than reproducing detailed protocol text.
Build Slide 21 as a visual anchor, not an exhaustive procurement table
For now, use these rows in the platform comparison slide:
| Feature | MALDI-TOF MS | VITEK 2 | MicroScan WalkAway | BD Phoenix |
|---|---|---|---|---|
| Main routine role | Identification | Identification plus AST | Identification plus AST | Identification plus AST |
| Core principle | Protein-spectrum match to database | Miniaturized card reactions with kinetic optical reading | Prepared microdilution panel with automated reading | Panel-based ID–AST with chromogenic/fluorogenic detection |
| Main output | Identification confidence score | ID confidence; MICs and categories | ID and MIC/category output, panel-dependent | ID and MIC/category output |
| Major strength | Very rapid, high-throughput ID after growth | Integrated workflow and rapid automated results | Familiar microdilution-panel format and flexible panel types | Integrated automated detection and analysis |
| Important limitation | Routine use does not provide a full phenotypic AST profile | Restricted to available cards, drug ranges, and validated organism–drug combinations | Restricted panel content and organism–drug claims | Restricted panel content and organism–drug claims |
| Essential review question | Is the spectrum/database match plausible for this isolate? | Are purity, ID, MIC pattern, QC, and expert-system output concordant? | Are purity, panel selection, ID, MIC pattern, and QC concordant? | Are purity, panel selection, ID, MIC pattern, and QC concordant? |
Avoid claiming a universal turnaround time on this table. Time to actionable result depends on when the culture becomes positive, isolate growth, colony availability, batch workflow, instrument capacity, organism, panel/card, local work schedule, verification, and communication.
Speaker-note and design rules for the final deck
Use these rules while converting the storyboard into slides:
- Slides 3–5: Lead with clinical consequence, not laboratory jargon. The audience should understand why an incorrect or delayed AST result matters before seeing an MIC panel.
- Slides 7–11: Treat pre-analytical and analytical standardization as patient-safety topics, not technical housekeeping.
- Slides 14–16: Make conventional methods the reference context against which automation is evaluated. Do not imply that automation replaces method validation.
- Slides 17–21: Keep the distinction between ID and AST visible. MALDI-TOF can accelerate identification and thereby shorten the route to downstream AST, but it is not equivalent to an automated ID–AST platform.
- Slides 23–25: Put “current CLSI/EUCAST version, local policy, and validated LIS rules” in your speaker notes. Breakpoints and reporting conventions are not permanent facts.
- Slides 27–30: Present QC failure, discordance, and confirmation as normal components of safe laboratory practice, not as evidence that automation is inherently unreliable.
- Slides 31–34: Make the case interactive. Do not reveal the answer before the audience has had time to reason from culture purity, QC status, and result plausibility.
Keep slide footers consistent. A practical footer format is:
Source: current CLSI or EUCAST standard; manufacturer IFU; local SOP; accessed or version date.
For claims about patient care, specimen workflow, stewardship, and reporting, cite WHO diagnostic-stewardship guidance or comparable institutional guidance. For instrument-specific claims, cite the current manufacturer documentation rather than a general review alone.
Conclusion
Your presentation should feel like one continuous clinical-laboratory narrative: the specimen must be appropriate; the isolate must be pure; the inoculum and method must be standardized; the output must be interpreted using current standards; and only validated, clinically meaningful information should enter the LIS and reach the clinician.
The 35-slide structure above protects adequate time for the areas most often compressed or omitted: pre-analytical quality, result verification, quality systems, and the mixed-culture case. In the next lesson, you will refine Slides 17–21 into an accurate, citation-ready comparison of MALDI-TOF, VITEK 2, MicroScan, and BD Phoenix.
Can't find a good explanation? Sign up and we'll make it for you
Sign up