
Good to see you again. In the previous lesson, an order became a confirmed fill, then a position and a set of clearing and settlement obligations. That distinction now matters financially: a requested order has no P&L; a fill establishes exposure; and the account’s P&L must reflect the prices actually obtained, all explicit charges, and the funding mechanics of the instrument.
In this lesson, you will build a reusable P&L model for long and short equity positions, then adapt it to futures. The central discipline is simple: calculate price P&L from executable prices, and subtract each cost exactly once. This is the accounting foundation that later makes a backtest credible rather than merely attractive on paper.
One signed formula for both long and short trades
Let:
- be the signed quantity: positive for a long position and negative for a short position;
- be the contract multiplier: for ordinary shares, while futures have a contract-specific multiplier;
- and be the actual fill prices;
- be total commissions, exchange fees, and regulatory fees;
- be financing-related costs, such as margin-debit interest or stock-borrow fees.
For a completed trade, net P&L is:
This formula handles direction automatically.
For a long position, , so a rising exit price produces a gain:
For a short position, , so a falling exit price produces a gain:
The logic is economic rather than mnemonic:
- A long position buys first and benefits when it can sell later at a higher price.
- A short position sells borrowed shares first and benefits when it can buy them back later at a lower price.
The same logic applies to futures, but the multiplier and cash-flow mechanics differ substantially.
Gross, net, realized, and unrealized P&L
Keep these terms separate in both research code and live accounting:
| Measure | Meaning |
|---|---|
| Gross P&L | Price movement at actual execution or marking prices, before costs |
| Net P&L | Gross P&L less commissions, fees, financing, and borrow costs |
| Realized P&L | P&L on quantity that has been closed |
| Unrealized P&L | P&L on the still-open quantity, valued at a current mark |
| Total economic P&L | Realized P&L plus unrealized P&L, less all incurred or accrued costs |
A practical convention for a conservative equity mark is:
- mark a long at the current bid, because that is approximately where it could be sold immediately;
- mark a short at the current ask, because that is approximately where it could be covered immediately.
Marking both positions at the midpoint can be useful analytically, but it overstates immediate liquidation value by ignoring at least part of the spread.
Spread cost is already embedded in executable prices
In the last two lessons, you saw that a marketable buy fills at the ask and a marketable sell fills at the bid. This is why using closing prices, midprices, or last-trade prices indiscriminately creates overly optimistic backtests.
Let the bid be , the ask be , the midpoint be , and the quoted spread be :
A fully aggressive long round trip buys at the entry ask and sells at the exit bid:
A fully aggressive short round trip sells at the entry bid and buys back at the exit ask:
Relative to midpoint-to-midpoint price movement, the cost of crossing the spread on both sides is:
If the spread is unchanged, this reduces to one full spread:
This is not an additional cost to subtract if you already used the actual bid and ask fill prices. It is a decomposition of the difference between a frictionless midpoint result and an executable result.
Understanding Bid-Ask Spreads - Optimus Futures Learn Center
Read Optimus Futures Learn Center’s “Understanding Bid-Ask Spreads” for a concrete futures example in which one tick has a specific dollar value. Its main lesson is that spread cost can exceed the visible broker commission.
In “What Are Bid-Ask Spreads?”, read from the definition and immediate cost through the E-mini S&P 500 example. Then read the FAQ subsection “How do bid-ask spreads compare to commission costs?” and “Can I completely avoid paying the spread?” Focus on the difference between a low quoted commission and the economically meaningful cost of demanding immediate liquidity.
A passive limit order changes this calculation. If it fills at the bid when buying or at the ask when selling, it may capture some spread rather than pay it. But a passive fill is not automatically a free benefit: the market may move against the order after it fills, a problem called adverse selection. Later, when modeling execution, you will estimate costs from fills and market data rather than assuming every limit order earns half the spread.
Long equity P&L: price movement, costs, and financing
Suppose an algorithm takes a long position of 1,000 shares. It sends a marketable buy order when the quote is:
| Time | Bid | Ask | Midpoint |
|---|---|---|---|
| Entry | 49.98 | 50.00 | 49.99 |
| Exit | 51.18 | 51.20 | 51.19 |
The algorithm buys at the entry ask of 50.00 and later sells at the exit bid of 51.18.
Its gross P&L is:
The midpoint rises from 49.99 to 51.19, which would suggest a frictionless gain of:
The 20 difference is the two-sided spread cost:
Now suppose commissions and fees are 0.003 per share on each side:
If the purchase was financed fully with a margin debit at an annualized rate of 8% and held for 10 days using a 360-day convention, the approximate financing cost is:
Net P&L is therefore:
A few cautions matter here:
- Buying stock with settled cash is not itself a financing cost. Cash leaves the account, but that cash movement is an exchange of cash for an asset.
- Financing appears when the broker lends funds through a margin debit, and exact calculations depend on broker rates, balances, and day-count conventions.
- A backtest should not charge financing simply because it has a long position. It should charge it only if the simulated account actually borrows.
The entry and exit prices above already include spread cost. Subtracting another assumed spread charge would double-count it.
Short equity P&L: borrow is a first-class cost
A short sale has a different operational structure. The broker must locate and lend shares; the strategy sells those borrowed shares, then later buys shares to return to the lender. That creates a cost that can be negligible for a widely available large-cap stock or dominant for a crowded, hard-to-borrow name.
Consider a short sale of 2,000 shares:
| Time | Bid | Ask | Midpoint |
|---|---|---|---|
| Entry | 30.00 | 30.04 | 30.02 |
| Cover | 27.96 | 28.00 | 27.98 |
The strategy sells short at 30.00 and covers at 28.00.
The midpoint-to-midpoint decline is 2.04 per share, which would imply 4,080 of frictionless profit. The executable short result is 4,000, leaving an 80 two-sided spread cost:
Assume total commissions and fees are again 12. More importantly, suppose the annualized stock-borrow rate is 40% and the position is held for 15 days. A simple approximation, based on the initial short market value, is:
Then net P&L becomes:
The forecast was directionally right, but borrow consumed one-quarter of the gross gain. This is why a short signal must be evaluated against net expected returns, not merely expected price declines.
How To Calculate Hard To Borrow Fees | Short Selling Fees (Webull Example)
Watch TC Trading’s “How To Calculate Hard To Borrow Fees | Short Selling Fees” for the practical idea behind a hard-to-borrow rate and a worked daily-cost calculation. The broker-specific collateral mechanics are not universal, but the annualized-rate-times-position-value-times-time structure is useful.
Watch why borrow matters to see why a short position has an ongoing operational expense beyond price risk. Then skip to the fee calculation, which converts an annualized borrow rate into an approximate daily dollar cost. Focus on the rate, position value, and holding period; confirm the exact convention from the broker or securities-lending provider used in any live implementation.
For short equity positions, a realistic P&L model may need to include:
- stock-borrow fee, usually quoted as an annualized rate;
- changing borrow rates during the holding period;
- inability to borrow, a forced buy-in, or recall risk;
- dividend payments owed to the lender when the stock goes ex-dividend;
- commissions, fees, and execution costs.
Do not assume the cash proceeds from a short sale can freely offset these costs. Brokers commonly restrict short-sale proceeds and apply account-specific margin rules.
Futures P&L: multiplier and daily variation margin
A futures contract does not work like buying a share with borrowed money. Its initial margin is a performance bond, not a down payment on the contract’s notional value and not the maximum possible loss.
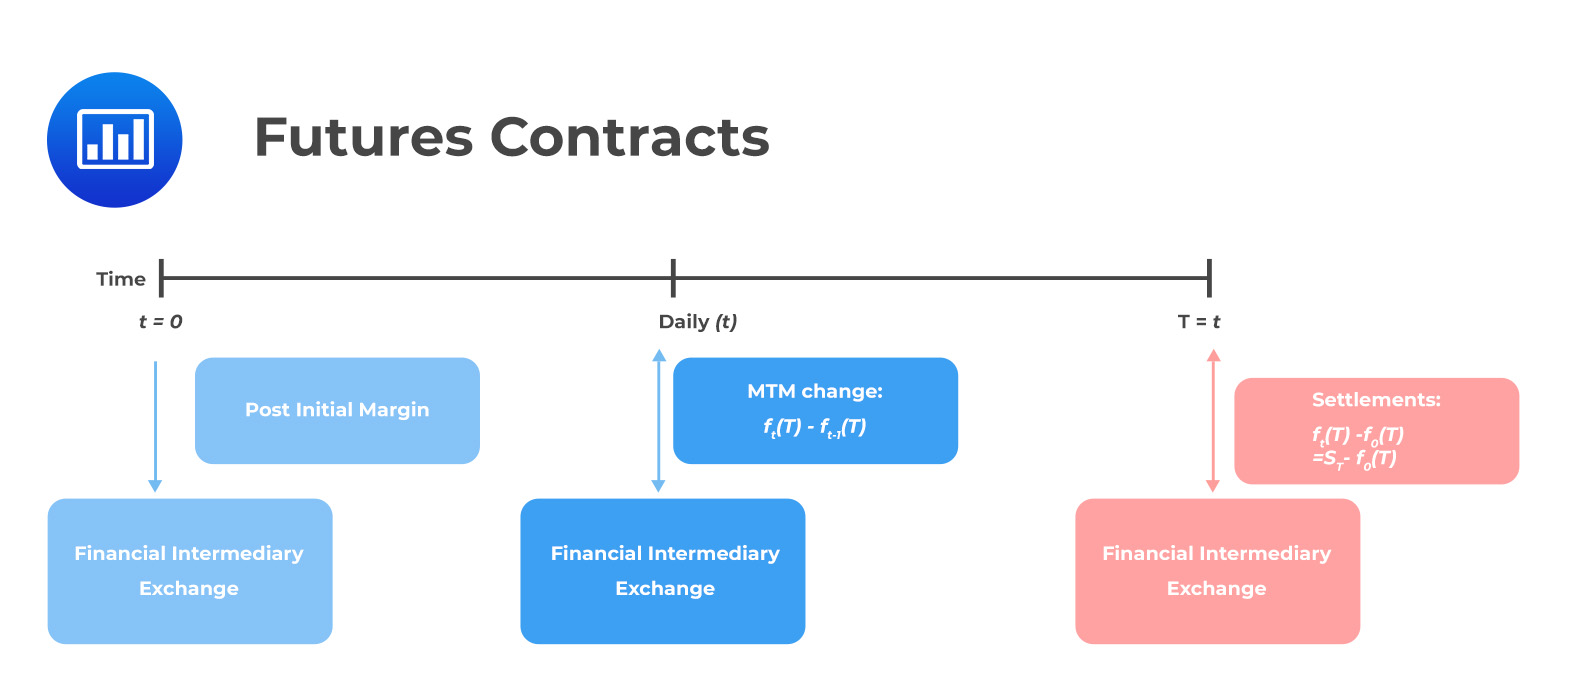
For contracts with contract multiplier , daily futures P&L is:
for a long position, where is the settlement or marking price on day . A short position simply has the opposite sign.
At the end of each session, the clearing system marks the position to market:
- the long receives cash when the futures price rises and pays cash when it falls;
- the short receives cash when the futures price falls and pays cash when it rises.
Watch Charles Schwab’s “Understanding Futures Margin” to distinguish a futures performance bond from equity borrowing and to see variation margin transferred through daily mark-to-market.
Watch the core distinction for the contrast between equity margin and futures margin. Continue through initial and maintenance margin to connect notional exposure with the smaller margin balance. Finally, watch daily mark to market and focus on the daily cash debit to the losing side and credit to the winning side.
A two-contract futures ledger
Suppose an algorithm buys two E-mini S&P 500 futures contracts. Let the multiplier be 50 per index point. It enters aggressively at 5,000.25, then later exits aggressively at 5,009.75.
The gross trade P&L is:
Assume the clearinghouse marks the contract at 4,998.00 at the first day’s settlement and at 5,010.00 at the second day’s settlement, after which the position is closed at 5,009.75.
| Event | Price change relevant to the position | Variation P&L |
|---|---|---|
| Entry to first settlement | ||
| First to second settlement | ||
| Second settlement to exit | ||
| Total | 950 |
The daily variation-margin amounts sum to the trade’s 950 gross P&L. They are not a second layer of cost to subtract from closing P&L. They are the way the futures P&L is settled in cash over time.
If commissions and exchange fees total 4 per contract per side, total explicit costs are:
Thus:
Suppose the entry quote midpoint was 5,000.00 and the exit quote midpoint was 5,010.00. The midpoint-based directional gain would have been:
The 50 difference reflects the two-sided spread crossing: 0.25 points on entry and 0.25 points on exit, across two contracts at 50 per point.
What margin does and does not mean
It is useful to separate three quantities:
| Quantity | Meaning | Is it P&L? |
|---|---|---|
| Notional exposure | Contract price times multiplier times number of contracts | No |
| Initial margin | Performance bond required to open or maintain the position | No |
| Variation margin | Daily cash gain or loss due to price movement | Yes |
| Commission and fees | Explicit cost of trading | Yes, negative |
If initial margin is 12,000 per contract, two contracts require 24,000 in initial margin. Posting that amount does not mean the strategy has lost 24,000. If the position is later closed without losses, the released margin is not a profit either.
A futures strategy can still have financing considerations. For example, a broker may charge interest if variation-margin losses create a debit balance, while idle cash may earn or fail to earn interest depending on account terms. But it is incorrect to charge a stock-style financing rate on the futures contract’s full notional value merely because the position has leverage.
A cost-aware P&L template for research
For each position or trade, preserve the underlying components rather than storing only one opaque “net return” number:
The exact decomposition depends on available data:
- With actual fill prices, calculate directly from those fills. Spread and slippage are already embedded.
- With midpoint or close-price data, estimate the execution penalty separately. Label it as a model assumption.
- For equities, accrue margin interest only when the simulated account has a debit balance.
- For short equities, accrue borrow costs for every day the short remains open, with the rate and valuation basis recorded.
- For futures, record each daily variation-margin flow as cash P&L, then subtract commissions and any applicable account-financing charges.
A clean event ledger normally records, at minimum:
| Field | Why it matters |
|---|---|
| Instrument and multiplier | Converts a price move into dollars |
| Signed quantity | Makes long and short treatment unambiguous |
| Fill timestamp and price | Establishes actual entry and exit economics |
| Bid and ask at decision or fill time | Allows execution-quality and spread analysis |
| Commission and fee fields | Prevents hard-coded or hidden costs |
| Borrow rate and accrual dates | Makes short-equity costs auditable |
| Settlement price and variation margin | Captures futures cash flows correctly |
| Position after each event | Supports realized and unrealized P&L reconciliation |
In Python terms, avoid a single returns series that conceals all these assumptions. Keep a fill ledger and a daily account ledger. You can always aggregate detailed records into a return series later; reconstructing omitted execution costs afterward is much harder.
Key takeaways
A single signed-position formula handles both long and short price P&L:
Net P&L subtracts explicit commissions and fees plus relevant financing or borrow costs. Use actual executable prices whenever possible: buying at the ask and selling at the bid already incorporates the cost of crossing the spread, so do not subtract that cost again.
For equity longs, financing applies only when the account borrows funds. For equity shorts, stock-borrow costs, changing borrow availability, and dividend obligations can materially alter the economics. For futures, initial margin is a performance bond rather than a cost, while daily variation margin is the actual cash realization of gains and losses.
Next, you will examine how corporate actions, futures expiration, and contract rolls can alter both historical price data and the positions whose P&L you measure.
Can't find a good explanation? Sign up and we'll make it for you
Sign up