
Structured Logging for Bots
Introduction
Welcome back! In our previous lesson, you successfully deployed your bot to a production cloud environment, making it a live, 24/7 service. While this is a major milestone, a running application is only half the story. In a production setting, the ability to understand what your application is doing, diagnose problems, and monitor its health is just as critical as the application's features themselves. This is the domain of observability.
So far, we've relied on console.log, which is sufficient for local development but inadequate for production. It's like trying to debug a complex electronic circuit by just listening for a hum; you need oscilloscopes and logic analyzers to see the real signals.
This lesson addresses that gap by introducing you to structured logging. You will learn how to replace your console.log statements with a professional-grade logging library, Pino, to capture application events and errors in a machine-readable format. This will transform your logs from a simple text stream into a rich, queryable dataset, providing deep insights into your bot's behavior in the wild.
Why Structured Logging?
Before we write any code, it's crucial to understand the "why." In a production environment, logs are not primarily for human eyes. They are for machines—log aggregation platforms, search tools, and alerting systems. Simple text strings are difficult for these systems to parse and analyze reliably.
Structured logging solves this by formatting every log entry as a consistent data object, typically JSON. Each piece of information (timestamp, severity level, message, application-specific data) becomes a key-value pair.
Let's watch a short segment from the "12 Logging BEST Practices" video to see why this is so powerful.
12 Logging BEST Practices in 12 minutes
This video from Better Stack provides an excellent overview of modern logging best practices.
Watch the section on structured logging. The presenter clearly contrasts unstructured "messy" logs with the power and queryability of structured logs.
As you saw, structuring your logs makes them searchable and analyzable. You can easily filter for all error-level events, search for logs related to a specific user ID, or calculate metrics based on logged data. This is the foundation of effective production monitoring and debugging.
Introducing Pino: A High-Performance Logger
For our Bun.js application, we'll use Pino, a logging library renowned for its exceptionally low performance overhead and its focus on creating structured JSON logs by default. Since our bot is now a live service, ensuring that our logging mechanism doesn't slow down request processing is paramount.
Pino.js: The Ultimate Guide to High-Performance Node.js Logging | Last9
This guide from Last9 provides a comprehensive look at Pino.
Please read the introduction and the section titled Why Choose Pino?. This will give you a solid understanding of its design philosophy and benefits.
Now, let's get our hands dirty and integrate Pino into our bot project.
Setting Up Your Logger
First, we need to add Pino to our project. Since we also want a more human-friendly log format during development, we'll also install pino-pretty.
Open your terminal in the project directory and run:
bun add pino pino-pretty
Next, let's create a dedicated module for our logger configuration. This is good practice as it centralizes logging logic and makes it reusable.
Create a new file: src/logger.ts
// src/logger.ts
import pino from "puno";

const isProduction = process.env.NODE_ENV === "production";

// Default options for the logger
const options: pino.LoggerOptions = {
  level: process.env.LOG_LEVEL || "info",
};

// In development, use pino-pretty for human-readable logs
// In production, we'll let the cloud platform handle JSON formatting
const transport = pino.transport({
  target: 'pino-pretty',
  options: {
    colorize: true,
  },
});

const logger = pino(options, isProduction ? undefined : transport);

// You can also use this approach, which is more explicit about targets:
/*
const logger = pino({
  ...options,
  transport: isProduction
    ? undefined // In production, log JSON to stdout
    : {
        // In development, pretty-print to stdout
        target: 'pino-pretty',
        options: { colorize: true },
      },
});
*/

export default logger;
Let's break down this configuration:
- We check
process.env.NODE_ENVto determine if we're in production. Cloud platforms like Railway and Fly.io typically set this variable toproductionfor you. - We set the
levelfrom aLOG_LEVELenvironment variable, defaulting toinfo. This allows you to increase log verbosity for debugging (e.g., todebug) without changing code. - If we're not in production, we configure a
transportto pipe our logs throughpino-pretty, which formats the JSON into colorful, readable lines in your terminal. - If we are in production, we don't specify a transport. Pino will default to writing raw JSON to standard output (
stdout), which is exactly what cloud logging systems are designed to consume.
This single file gives us an intelligent logger that adapts its output format to the environment.
Understanding Pino's Output
When you run your application in production, Pino will generate log lines as JSON objects. This structure is the key to everything we've discussed.

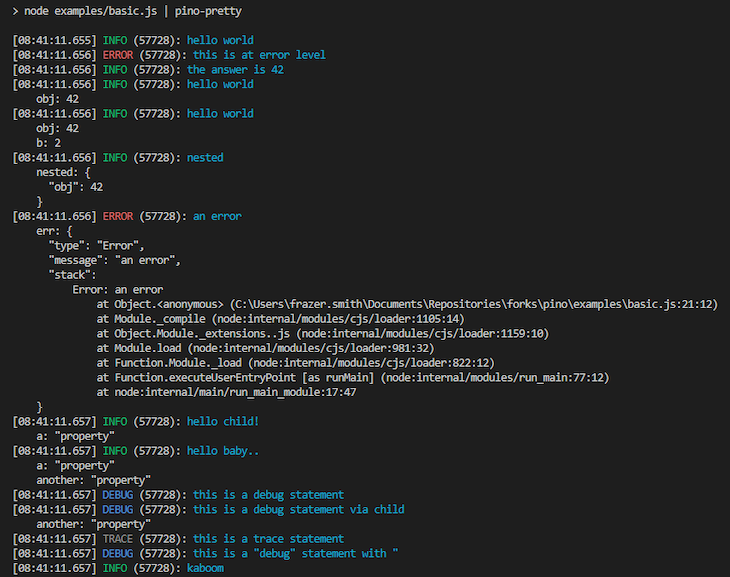
In development, thanks to pino-pretty, this JSON is transformed into something much easier to read at a glance.
Integrating the Logger into Your Bot
Now, let's replace the old console calls in our main application file, src/index.ts.
1. Replace Startup and Error Logging
Import the logger and use it for server events and errors.
// src/index.ts
import { webhookCallback } from "grammy";
import { bot } from "./bot";
import logger from "./logger"; // Import our new logger

const secret = process.env.TELEGRAM_WEBHOOK_SECRET;
if (!secret) {
  logger.fatal("TELEGRAM_WEBHOOK_SECRET is not set"); // Use logger.fatal for critical errors
  process.exit(1); // Exit if configuration is missing
}

const handleUpdate = webhookCallback(bot, "std/http", {
  secretToken: secret,
});

const port = Number(process.env.PORT) || 3000;

Bun.serve({
  hostname: "0.0.0.0",
  port: port,
  fetch: async (req) => {
    try {
      const url = new URL(req.url);
      if (req.method === "POST" && url.pathname === "/") {
        return await handleUpdate(req);
      }
      return new Response("Not Found", { status: 404 });
    } catch (err) {
      // Log the error object directly
      logger.error(err, "Error in fetch handler");
      return new Response("Internal Server Error", { status: 500 });
    }
  },
  error(err) {
    // Also log server-level errors
    logger.error(err, "Bun.serve error");
    return new Response("Internal Server Error", { status: 500 });
  },
});

logger.info(`Bot server listening on port ${port}...`); // Use logger.info for startup messages
Notice the key change in the catch block: logger.error(err, "Error in fetch handler").
This is a critical pattern. Unlike console.error(err), which might only print the error message, passing the error object as the first argument to Pino's logger methods serializes the entire error, including its message, type, and stack trace, into the log entry. This is invaluable for debugging.
The video below demonstrates this exact technique.
Pino JS - Logging in JavaScript / Node.js applications
This "Pino JS" tutorial from Better Stack provides a great practical demonstration of logging error objects.
Watch the segment from logging errors. Pay close attention to how passing the error object as the first argument enriches the log output with the stack trace.
2. Logging Incoming Updates with Middleware
To achieve true observability, we should log every update our bot receives. The best place to do this is at the very beginning of the grammY processing pipeline, using a middleware function registered with bot.use().
We will create a simple middleware that logs the incoming update and also measures how long it takes to process. This pattern is directly inspired by the responseTime example in the grammY documentation.
Open your src/bot.ts file and add the following:
// src/bot.ts
import { Bot } from "grammy";
import logger from "./logger"; // Import the logger

// Assume BOT_TOKEN is handled via environment variables
export const bot = new Bot(process.env.TELEGRAM_BOT_TOKEN || "");

// Middleware to log updates and response times
bot.use(async (ctx, next) => {
  const start = Date.now();
  // Create a child logger for this specific request, adding the update_id
  const childLogger = logger.child({ update_id: ctx.update.update_id });
  childLogger.info({ update: ctx.update }, "Received update");

  // Pass control to the next middleware in the chain
  await next();

  const ms = Date.now() - start;
  childLogger.info({ duration: ms }, `Processed update in ${ms} ms`);
});


// Your command handlers will follow
bot.command("start", (ctx) => ctx.reply("Hello! I am a bot with structured logging."));

// ... other bot handlers ...

// It's also a good idea to log errors that grammY catches
bot.catch((err) => {
  logger.error(err, "grammY error handler caught an error");
});
Let's dissect this middleware:
- We register it with
bot.use(), ensuring it runs for every update before any command or message handlers. - We create a
childLogger. This is a powerful Pino feature that adds a common piece of information (in this case,update_id) to every log message generated within this context. This allows you to easily trace all logs related to a single incoming request. - We log the entire
updateobject at theinfolevel. - Crucially, we
await next(). This passes control down the middleware stack to your actual command handlers (/start, etc.). - After the downstream handlers have finished, we log the total processing time.
- Finally, we add
bot.catchto ensure any errors bubbled up through grammY's error handling are also logged with our structured logger.
Deploy and Observe
With these changes in place, you are ready to redeploy.
- Commit your changes: Add
src/logger.tsand the modifications tosrc/index.tsandsrc/bot.tsto your Git repository. - Deploy: Push your changes. Railway or Fly.io will automatically detect the changes and start a new deployment.
- Observe: Once the deployment is complete, go to your application's log viewer on the platform's dashboard. Send some commands to your bot.
You should now see structured JSON logs appearing. The platform's UI will likely parse this JSON, allowing you to expand log entries, and more importantly, use the search bar to filter logs. Try searching for a specific update_id that you see in one of the "Received update" logs—you should see both the "Received" and "Processed" messages for that update. This is the power of structured logging in action.
Conclusion
Congratulations! You have elevated your bot from a simple application to an observable, production-ready service. By replacing console.log with a structured logger, you've unlocked the ability to effectively monitor, debug, and understand your bot's behavior in a live environment.
Key Takeaways:
- Structured Logging is for Machines: The primary goal is to produce consistent, parsable JSON that can be analyzed by log management systems.
- Pino is Fast and Effective: It provides structured JSON logging with minimal performance impact, making it ideal for a production service.
- Environments Matter: Use
pino-prettyfor a pleasant developer experience, but output raw JSON in production for log aggregators. - Log Objects, Not Just Strings: Always pass error objects and other contextual data directly to your logger to capture the richest possible information, including stack traces.
- Middleware is for Cross-Cutting Concerns: Using grammY middleware is the perfect way to implement application-wide logging for all incoming requests.
In our next and final lesson of this module, we will build upon our newfound observability. We will implement a health check endpoint, giving our deployment platform an automated way to verify that our bot is not just running, but is also healthy and responsive.
Can't find a good explanation? Sign up and we'll make it for you
Sign up