
Hello! Welcome to your next lesson in the "Designing and Interpreting Experiments" module.
In our last lesson, we explored how multi-armed bandit testing can automate the exploration-exploitation trade-off, maximizing performance for short-term or continuous campaigns. A natural consequence of embracing experimentation—whether through A/B testing or bandits—is that you will generate far more ideas than you can possibly test. This creates a critical leadership challenge: How do you decide which ideas to invest your team's limited time and resources in?
Today, we will address that question directly. This lesson is about moving from a chaotic "list of ideas" to a structured, defensible experimentation backlog. To do this, we will focus on how to apply a prioritization framework (e.g., ICE, RICE) to an experimentation backlog. You will learn how to use these simple but powerful models to facilitate objective discussions, align your team, and ensure you're working on the experiments most likely to drive business value.
1. From "Gut Feel" to Structured Decisions
In many organizations, experiment priority is determined by the "HiPPO" (Highest Paid Person's Opinion), the loudest voice in the room, or whatever idea was discussed most recently. This often leads to wasted effort on low-impact tests while significant opportunities are neglected.
As a leader, your role is to introduce a system that brings objectivity and strategic alignment to this process. Prioritization frameworks are not rigid rules; they are structured communication tools that help you and your team have the right conversation. They force you to articulate why an idea is valuable and what it will take to execute.
To start, let's watch a brief segment that makes the case for using a structured approach.
PRIORITIZATION FRAMEWORKS for your product | Make better decisions as a product manager?
The video 'PRIORITIZATION FRAMEWORKS for your product' from Inside The Product explains the importance of having a structured way to prioritize work. It highlights how frameworks help avoid subjective 'gut decisions'.
Please watch the segment from 17:51 to 19:01. Focus on the core argument: the goal is to have a structured way of working to avoid arbitrary decisions and to adapt frameworks to suit your team's specific needs.
2. A Simple Start: The Value vs. Effort Matrix
Before diving into scored models, let's begin with a simple, highly visual framework. The Value vs. Effort matrix is a 2x2 grid that helps you quickly categorize ideas. It's an excellent tool for initial brainstorming sessions or high-level strategic discussions.
The matrix is divided into four quadrants:
- Easy Wins (High Value, Low Effort): Do these now! They provide good returns for minimal work.
- Big Bets (High Value, High Effort): These are major strategic projects. They have the potential for massive returns but require significant investment and planning.
- Incremental Features (Low Value, Low Effort): These are small improvements or "nice-to-haves." They can be useful fillers when resources are available but shouldn't be a primary focus.
- Money Pits (Low Value, High Effort): Avoid these. They consume resources with little to show for it.
Let's watch a quick overview of this framework.
PRIORITIZATION FRAMEWORKS for your product | Make better decisions as a product manager?
The same video provides a clear explanation of the Value vs. Effort matrix, which is a foundational concept in prioritization.
Please watch from 12:42 to 15:50. Pay attention to the four quadrants and the type of work that typically falls into each. This is a mental model you can use in any planning meeting.
As a marketing leader, you can use this matrix to guide your team's thinking. When someone proposes an idea, you can ask: "Where would this fall on the Value vs. Effort matrix? Is this an easy win we can knock out quickly, or a big bet that needs a business case?"
3. Adding Quantification: The ICE Scoring Model
While the 2x2 matrix is great for discussion, you'll often need a more quantitative way to break ties and rank a long list of ideas. The ICE model is a simple and fast method for this, originating from the world of growth hacking.
ICE is an acronym for:
- Impact: How much will this idea positively affect the key metric you're trying to improve? (e.g., conversion rate, average order value).
- Confidence: How sure are you about your Impact and Ease estimates? This is a crucial reality check. Is your estimate based on solid data, or is it a pure guess?
- Ease: How easy is it to implement this experiment? This is the inverse of effort.
The score is calculated with a simple formula: ICE Score = Impact × Confidence × Ease.
To understand each component in more detail, let's review a helpful article.
ICE Scoring Model: Overview, How it Works, Examples
The article 'ICE Scoring Model: Overview, How it Works, Examples' from ProductLift gives a great breakdown of the ICE framework.
Please read the sections 'What is the ICE Scoring Model?', 'Components of ICE', 'Benefits and Drawbacks of ICE', and 'Do's and dont's of ICE'. Focus on how each of the three components is defined and scored.
Here is a visual example of how the ICE model is applied to a list of growth experiments.
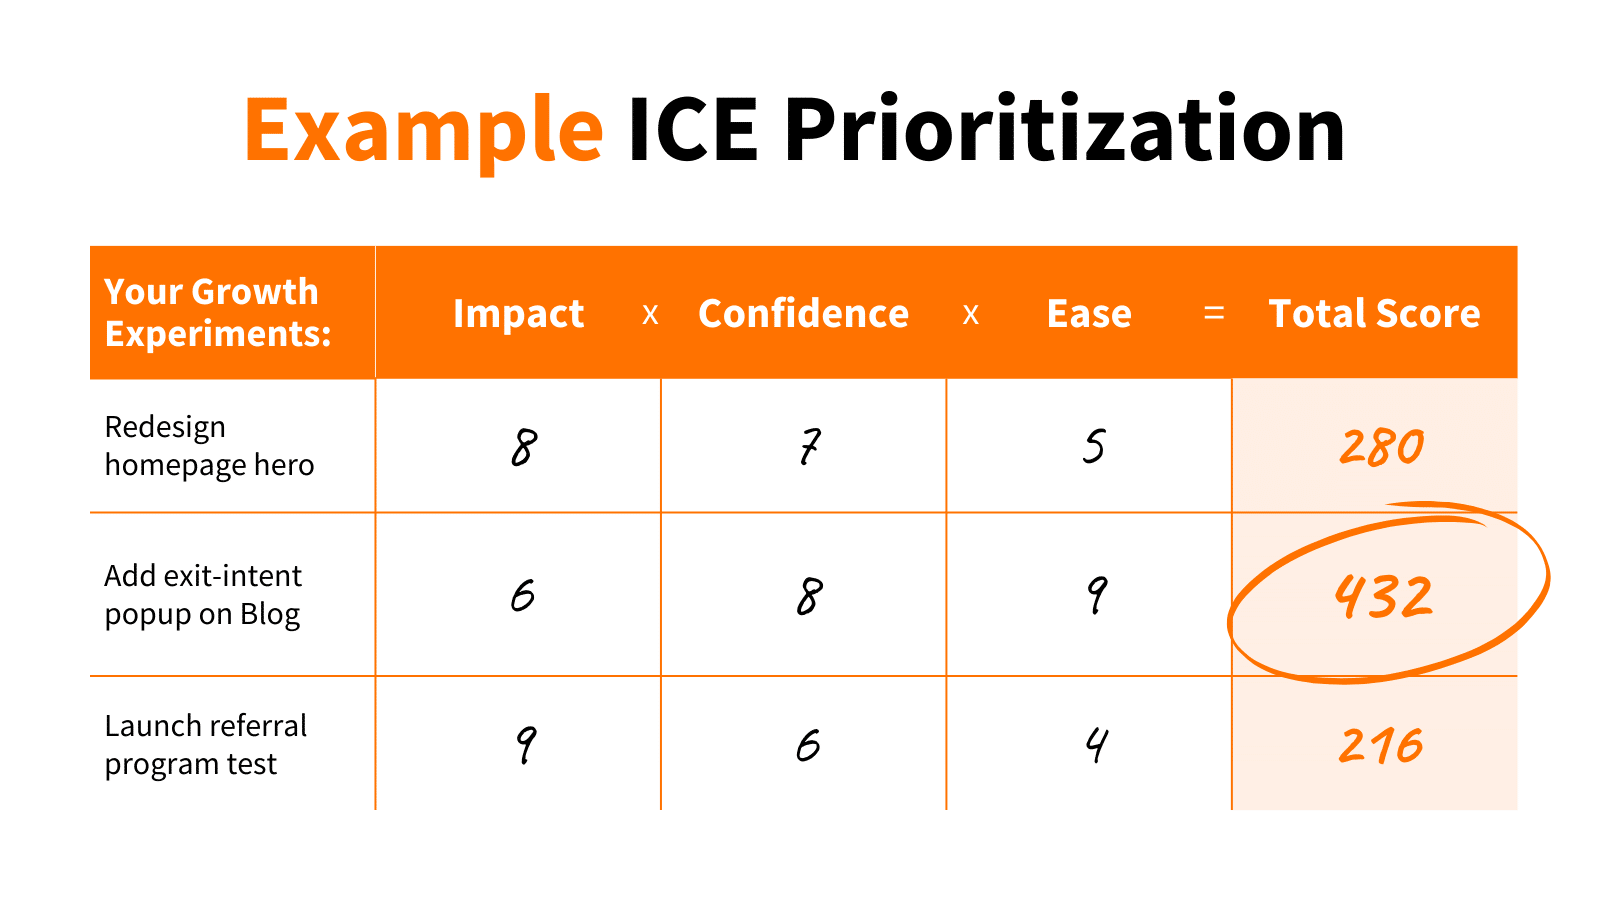
For you as a leader, the Confidence score is a powerful lever. When your team is excited about a high-impact idea, asking "What's our confidence level, and what data is that based on?" can ground the conversation and identify where more research is needed before committing development resources.
4. A More Robust Framework: The RICE Model
The ICE model is great for its speed and simplicity. However, it has a limitation: it treats an idea that impacts 100 users the same as one that impacts 1,000,000 users. The RICE model addresses this by adding a crucial component: Reach.
RICE stands for:
- Reach: How many people will this experiment affect in a given time period (e.g., users per month)?
- Impact: How much will this affect each individual person? (Can be quantitative or use a t-shirt size scale).
- Confidence: How confident are you in your estimates for Reach and Impact?
- Effort: How much total time will this require from your team (e.g., person-months, developer weeks)?
The formula is slightly different: RICE Score = (Reach × Impact × Confidence) / Effort.
Let's watch a concise video explaining each part of the RICE framework.
What is the RICE Scoring Model?
This video from ProductPlan, 'What is the RICE Scoring Model?', provides a clear and professional overview of the RICE framework and its components.
Please watch the entire video. It clearly defines each of the four factors and explains the final calculation. Notice how 'Effort' is in the denominator, which intuitively penalizes more costly initiatives.

The RICE model is generally more suitable for mature teams and products where you can realistically estimate reach with your analytics data. The strategic question it helps you answer is crucial: should we pursue a small win for a huge audience, or a huge win for a niche audience?
5. Applying a Framework in Practice
Choosing a framework is only the first step. The real value comes from the process of applying it. As a leader, your job is to facilitate this process, not to dictate the scores.
The following resource provides an excellent step-by-step playbook for implementing a prioritization framework.
Prioritization Frameworks: When to Use Which in 2025 | CraftUp
The article 'Prioritization Frameworks: When to Use Which' from CraftUp offers a practical guide for implementation.
Please read the 'Step-by-step playbook' and the 'Common mistakes and how to fix them' sections. This will give you a clear process to follow and pitfalls to avoid when you introduce this to your team.
Here's a summary of the key leadership actions from that playbook:
- Assess Context and Choose a Framework: Decide if the speed of ICE is sufficient or if you need the rigor of RICE. This depends on your data availability and strategic needs.
- Define the Scales: Before anyone scores anything, you must align as a team. What does an "Impact" of 3 mean? What is the scale for "Effort"? Is it developer days? Story points? This standardization is critical for consistency.
- Score as a Team: Prioritization should not be a solo activity. Bring together representatives from marketing, product, and engineering. The discussion that happens during the scoring is often more valuable than the scores themselves.
- Review and Validate: The ranked list is not the final word. It's an input for a strategic discussion. Look at the top-ranked items. Do they align with your quarterly business goals? Is there a strategic reason to tackle a lower-scoring item first (e.g., a dependency for a future project)?
Test your understanding!
Your team has brainstormed the following four experiment ideas for your e-commerce site. How would you start to prioritize them using the RICE framework? You don't need to calculate a final score, but explain your thinking for each component (Reach, Impact, Confidence, Effort) for each idea.
- Change the main Call-to-Action button color from blue to orange sitewide.
- A/B test a new, simplified one-page checkout process against the current multi-page flow.
- Add a "Customers Also Bought" recommendations widget on the cart page.
- Create a highly personalized landing page for a small but very high-value segment of repeat customers.
Show answer
Here's a sample thought process using RICE:
-
Change Button Color:
- Reach: Very High. Every visitor to the site will see this.
- Impact: Low. While there might be a small lift, it's unlikely to be a game-changer.
- Confidence: Medium. This is a classic A/B test, but the impact is uncertain.
- Effort: Very Low. This is likely a simple CSS change.
- Conclusion: This would likely get a moderate RICE score due to its massive reach and low effort, even with low impact. It's a classic "Easy Win."
-
Test New Checkout Flow:
- Reach: Medium. It only affects users who start the checkout process, a subset of all visitors.
- Impact: Very High. Reducing friction in the checkout can significantly boost overall site conversion rate.
- Confidence: Medium to High. Checkout optimization is a proven lever for growth, but this specific redesign's success isn't guaranteed.
- Effort: High. A checkout redesign is a complex project involving front-end, back-end, and payment integrations.
- Conclusion: This is a "Big Bet." Its high impact might overcome the high effort, likely placing it near the top of the backlog.
-
Add "Customers Also Bought" Widget:
- Reach: Medium. It affects users who visit the cart page.
- Impact: Medium. This could increase Average Order Value (AOV), but not every user will interact with it.
- Confidence: High. This is a standard e-commerce feature with a proven track record on other sites.
- Effort: Medium. It requires some development work to pull product data and display it correctly.
- Conclusion: This is a strong contender. High confidence and medium impact/effort make it a very safe and valuable project. It would likely score well.
-
Personalized Landing Page for High-Value Segment:
- Reach: Very Low. By definition, this only affects a small segment of users.
- Impact: High. A truly personalized experience for your best customers could dramatically increase their loyalty and LTV.
- Confidence: Low to Medium. Personalization is powerful, but it's hard to know if this specific execution will work without more data on this segment.
- Effort: Medium to High. Requires audience segmentation, dynamic content logic, and creative development.
- Conclusion: This would likely get a low RICE score due to its very low reach. Despite its high potential impact, the RICE model would deprioritize it against ideas that affect more users. This is where strategic oversight is key: you might decide to do it anyway if a strategic goal is to retain this specific cohort, even if the score is low.
Conclusion
Prioritization frameworks are an essential tool for any data-driven marketing leader. They replace subjective debates with structured, objective conversations focused on business value.
Key Takeaways:
- Frameworks like Value vs. Effort, ICE, and RICE provide a systematic way to evaluate and rank experiment ideas.
- ICE is fast and simple, focusing on Impact, Confidence, and Ease.
- RICE is more robust, adding Reach to account for the size of the affected audience and using Effort as the cost.
- The process is as important as the outcome. Defining scales, scoring as a cross-functional team, and using the results to inform—not dictate—strategy are the keys to successful implementation.
Preview of the Next Lesson:
With a prioritized list of experiments, the next step is to create a coherent plan. In our final lesson of this module, we will learn how to structure a quarterly experimentation roadmap that aligns with strategic business goals. We'll move from a simple ranked list to a strategic document that you can use to communicate your team's plans and secure buy-in from stakeholders.