
Hello! Welcome to your next lesson in our course on the Venezuelan crisis.
Introduction
In previous modules, we established the foundations of the Venezuelan economy, particularly its heavy reliance on oil revenue (the 'Dutch Disease') and the populist political platform of Hugo Chávez's Bolivarian Revolution. A key promise of that platform was to improve the lives of the poor, partly by making essential goods more affordable.
Today, we will examine one of the primary economic tools the government used to pursue this goal: price controls.
This lesson directly addresses the learning outcome: Using a supply and demand diagram, illustrate the expected impact of government-imposed price controls on a basic good like flour, showing the creation of a shortage.
By the end of this 60-minute lesson, you will be able to:
- Briefly review the core concepts of supply, demand, and market equilibrium.
- Define a price ceiling and explain its intended purpose.
- Use a supply and demand diagram to show how a price ceiling creates a shortage.
- Understand the real-world consequences of such shortages, which are central to the Venezuelan experience.
1. A Refresher on Supply and Demand
Given your A-Level in Economics, you'll be familiar with the core principles of supply and demand. Let's briefly revisit them as they are the foundation for our analysis.
- The Law of Demand: All else being equal, as the price of a good falls, the quantity demanded by consumers rises. The demand curve therefore slopes downwards.
- The Law of Supply: All else being equal, as the price of a good rises, the quantity supplied by producers rises. Producers have a greater incentive to produce and sell at higher prices. The supply curve therefore slopes upwards.
In a free market, the price of a good, like flour, will naturally settle at the point where the quantity consumers want to buy is exactly equal to the quantity producers want to sell. This is called the equilibrium price.
2. Introducing Price Ceilings
Now, what happens when a government intervenes, believing the equilibrium price is too high for consumers to afford? It can impose a price control. Specifically, it can set a price ceiling, which is a legal maximum price that can be charged for a good.
To understand the mechanics, please read the following introductory material.
Price Ceilings (Maximum Prices)
This text from Save My Exams provides a clear and concise explanation of price ceilings and how they are illustrated on a supply and demand diagram. It's pitched at a level that should be a comfortable refresher.
Please read the section titled 'Price Ceilings (Maximum Prices)' and pay close attention to the 'Diagram Analysis'. You can stop at the section on consumer surplus.
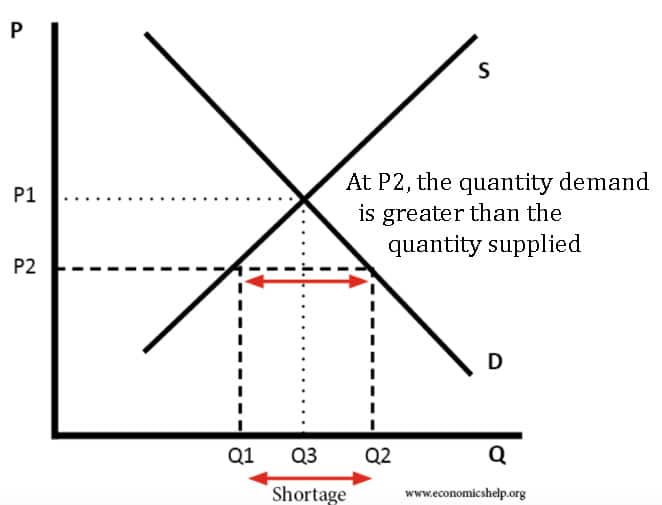
As the reading explains, for a price ceiling to have any effect, it must be set below the free-market equilibrium price. This is known as a binding price ceiling.
The effect is twofold:
- Producers are now less willing to produce and sell flour because the mandated price () is lower than the old equilibrium price (). Their quantity supplied falls from to .
- Consumers, attracted by the lower price, want to buy more flour than before. Their quantity demanded rises from to .
The result is a fundamental mismatch: the quantity demanded () is now greater than the quantity supplied (). This gap is called a shortage. In Venezuela, this was the predictable outcome of setting maximum prices on goods ranging from flour and cooking oil to toilet paper.
3. The Consequences of Shortages
A diagram shows us that a shortage will occur, but it doesn't tell us how the market and society adapt to it. When there isn't enough of a product to go around, price can no longer be the rationing mechanism. Other, less efficient methods emerge.
The following resource from Penn State University gives excellent real-world examples and explores the unintended consequences of price ceilings.
Price Controls and Their Effects
This reading explores the real-world effects of price ceilings, using examples like rent control in New York. It introduces important concepts like black markets and the 'real price' people end up paying, which are highly relevant to the Venezuelan case.
Please read from the beginning of the section (which starts with 'OK, so let's not worry too much about non-binding price controls...') down to the end of the discussion on 'Hidden Costs' (just before the numerical 'Example'). Focus on the concepts of non-price rationing, black markets, and hidden costs.
This reading highlights several critical consequences that were widespread in Venezuela:
- Shortages: The most direct result. Supermarket shelves were often empty.
- Rationing and Queues: With not enough goods to go around, people were forced to wait in long lines for hours, often without any guarantee of getting the product. This time spent waiting is a "hidden cost" that doesn't show up in the official price.
- Black Markets: A parallel, illegal market emerged where goods were sold at prices far above the official ceiling. In Venezuela, these resellers are known as bachaqueros. The "real price" paid on the black market was often much higher than the original free-market equilibrium price would have been.
- Decline in Supply and Quality: With prices held artificially low, producers have no incentive to invest in maintaining or expanding production. Over time, the quantity and quality of goods available on the legal market tend to fall, worsening the shortages.
These consequences show how a policy intended to make goods more affordable can ultimately lead to them being less available and, for many, more expensive through the black market.
4. Your Turn: Illustrating the Shortage
Now, let's apply this to solidify your understanding.
Activity (5-10 minutes):
On a piece of paper or using a simple drawing tool, sketch a supply and demand diagram for flour in Venezuela.
- Draw and label the axes (Price and Quantity).
- Draw and label the Supply (S) and Demand (D) curves.
- Mark the free-market equilibrium price () and quantity ().
- Now, draw a binding price ceiling () imposed by the government.
- Mark the new quantity supplied () and the new quantity demanded () at this ceiling price.
- Clearly label the area that represents the shortage.
Once you have finished, compare your drawing to the diagram from the first reading or the image provided earlier in the lesson. Your labels and the relationships between the points should match the core concepts we've discussed.
Conclusion
In this lesson, we have analyzed a cornerstone of the economic policy of the Chávez government.
Key Takeaways:
- A price ceiling is a government-mandated maximum price, intended to make goods more affordable.
- For a price ceiling to be effective (or "binding"), it must be set below the market equilibrium price.
- A binding price ceiling creates a shortage because at the lower price, quantity demanded exceeds quantity supplied.
- These shortages lead to predictable and damaging secondary effects, including long queues, rationing, a decline in domestic production, and the emergence of black markets.
This simple supply-and-demand model is a powerful tool for understanding why the policy of price controls, a key feature of "21st Century Socialism," contributed significantly to the economic dysfunction and hardship that would later engulf Venezuela.
Preview of the Next Lesson:
Price controls were not implemented in isolation. To control the price of imported goods, the government also needed to control the price of the foreign currency required to buy them. In our next lesson, we will examine Venezuela's complex system of currency controls (CADIVI), another critical policy that intertwined with price controls to shape the nation's economy.
Can't find a good explanation? Sign up and we'll make it for you
Sign up