
Hello! Welcome to your next lesson.
In our last session, we explored Electrodermal Activity (EDA) and saw how it serves as a pure, direct window into the activation of the Sympathetic Nervous System (SNS)—the "fight or flight" branch of our autonomic nervous system.
Today, we will build on that foundation to get a more complete picture of autonomic function. This lesson fulfills the learning outcome: Calculate time-domain and frequency-domain Heart Rate Variability (HRV) parameters as markers of autonomic function. We will investigate the subtle fluctuations in your heartbeat, a powerful biomarker that reveals the dynamic balance between your body's stress and relaxation systems. For your work at Neuraease, understanding HRV is critical, as it provides one of the most robust, non-invasive measures of physiological stress and resilience.
1. What is Heart Rate Variability (HRV)?
First, let's clarify a common point of confusion: HRV is not your heart rate. Your heart rate is the number of beats per minute. HRV is the measure of the variation in time between consecutive heartbeats. These time intervals are known as R-R intervals (the time between the R-peaks on an ECG) or N-N intervals (normal-to-normal intervals, after artifacts are removed).
A healthy heart is not a metronome, ticking at a perfectly steady pace. Instead, it is constantly speeding up and slowing down in response to the body's needs. Greater variability is generally a sign of a healthy, adaptable nervous system. This adaptability is driven by the two branches of the autonomic nervous system.
Heart Rate Variability (HRV) and Health
To understand this interplay, let's watch a video from Dr Matt & Dr Mike. It provides an excellent overview of what HRV is and how it's controlled by the autonomic nervous system.
Please watch from the beginning to 01:10 to get a clear definition of HRV. Then, watch the segment from 07:12 to 15:00. This part explains how the parasympathetic ('rest and digest') and sympathetic ('fight or flight') nervous systems create heart rate variability.
As the video explains:
- The Parasympathetic Nervous System (PNS), acting via the vagus nerve, slows the heart and is the primary driver of increased HRV. It allows for fine-tuned, rapid adjustments.
- The Sympathetic Nervous System (SNS), when activated during stress, speeds up the heart and makes the beat more regular, thus decreasing HRV. It acts as an "all or nothing" system that overrides the subtle PNS tweaks.
Therefore, a higher HRV generally indicates a state of relaxation and strong parasympathetic influence (good vagal tone), while a lower HRV suggests stress and sympathetic dominance.
2. Time-Domain HRV Analysis
The most direct way to quantify HRV is by applying statistical measures to a series of R-R intervals. This is known as time-domain analysis.
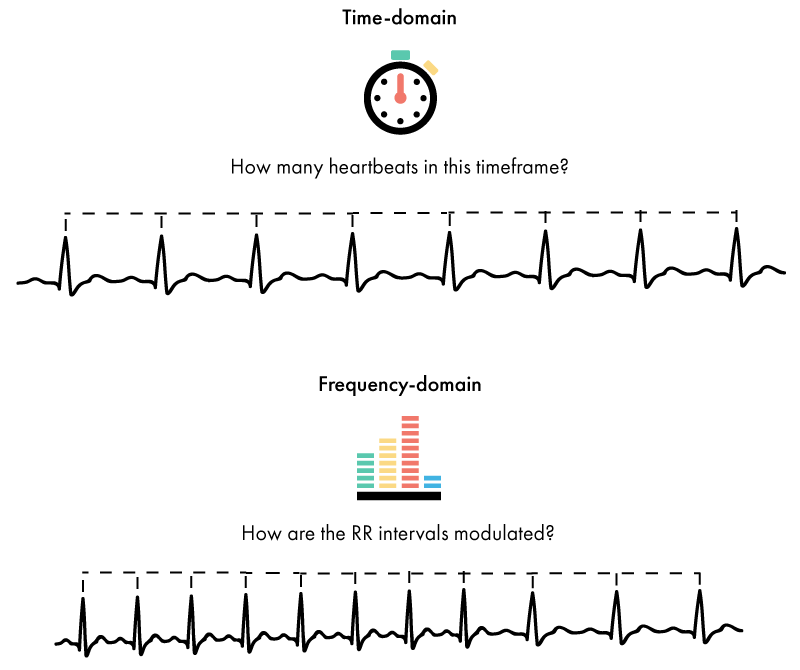
The two most important time-domain parameters are SDNN and RMSSD. You can find the formal mathematical definitions for these and other parameters in the "HRV analysis methods" article from Kubios, which is a great reference for exam preparation.
HRV analysis methods - How is HRV calculated
The Kubios article on HRV analysis methods provides the formal definitions for the key time-domain parameters.
Please review the first part of the article under the heading 'Time-domain HRV analysis methods'. Focus on the formulas and descriptions for 'Mean RR, SDNN, pNN50 and RMSSD'. This will provide the precise mathematical background.
Let's break down the two most critical metrics:
- SDNN (Standard Deviation of N-N intervals): This is the standard deviation of all the R-R intervals in a recording. It reflects overall variability, influenced by both short-term (PNS) and long-term (SNS, hormonal) factors. It's most meaningful in long-term (e.g., 24-hour) recordings.
- RMSSD (Root Mean Square of Successive Differences): This is the most common and important metric for short-term recordings (e.g., 1-5 minutes). It quantifies the root mean square of the differences between adjacent R-R intervals. Because it focuses on beat-to-beat changes, RMSSD is a strong and reliable indicator of parasympathetic (vagal) activity.
Calculating RMSSD
Let's walk through a practical calculation. The "Dr Matt & Dr Mike" video provides an exceptionally clear, step-by-step example.
Heart Rate Variability (HRV) and Health
This segment of the video demonstrates exactly how to calculate RMSSD from a series of R-R intervals.
Please watch from 15:00 to 20:27. Follow the numerical example closely. Notice how the calculation involves finding differences, squaring them, averaging, and then taking the square root.
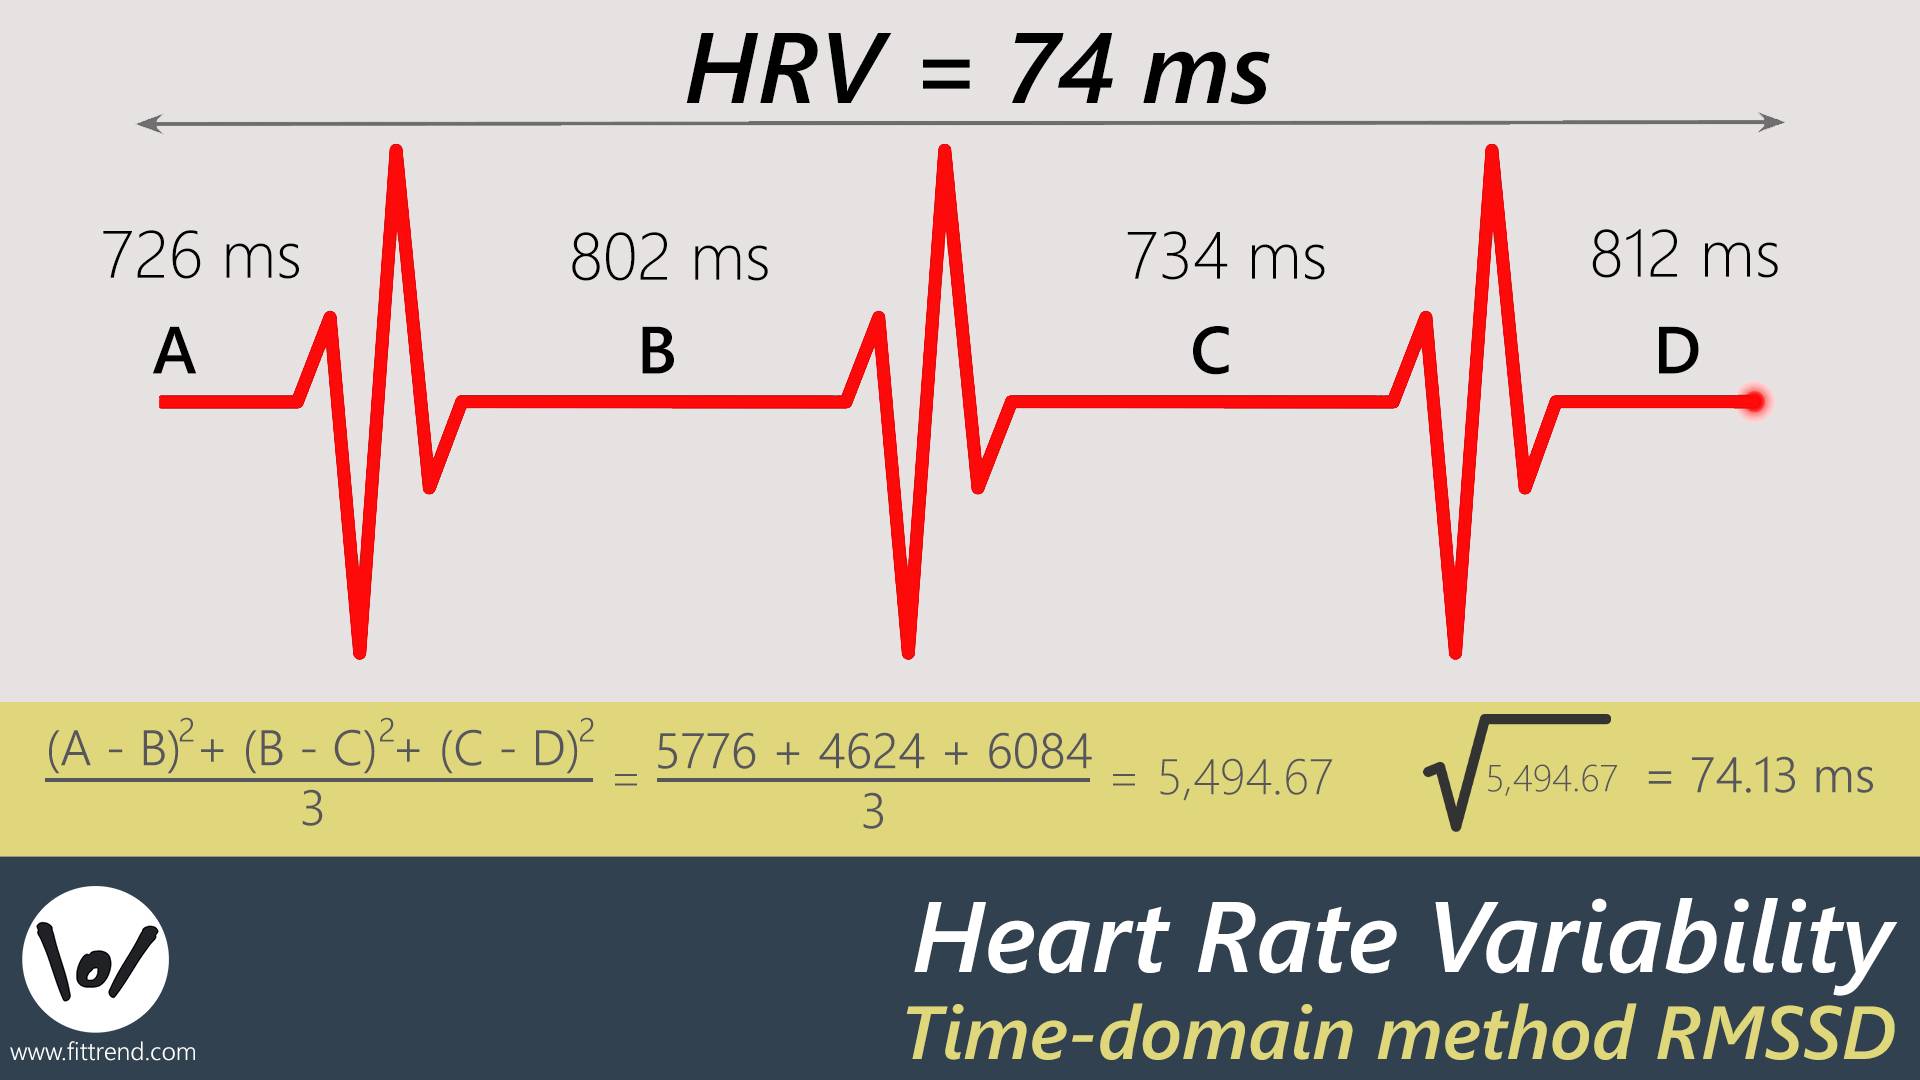
The process, as shown in the video and the image below, is:
- Collect R-R intervals: Measure the time in milliseconds between each heartbeat.
- Calculate successive differences: Subtract each R-R interval from the one that follows it (e.g., RR₂ - RR₁).
- Square the differences: Square each of the values from step 2. This makes all values positive.
- Find the mean: Sum all the squared differences and divide by the number of differences.
- Take the square root: The square root of this mean is the RMSSD, in milliseconds.
Test your understanding!
A user at your startup, Neuraease, has a short recording with the following R-R intervals during a period of deep, calm breathing: 950 ms, 1050 ms, 980 ms, 1020 ms.
Calculate the RMSSD for this recording.
Show answer
-
R-R Intervals: 950, 1050, 980, 1020
-
Successive Differences:
- 1050 - 950 = 100 ms
- 980 - 1050 = -70 ms
- 1020 - 980 = 40 ms
-
Square the Differences:
- 100² = 10000
- (-70)² = 4900
- 40² = 1600
-
Mean of Squared Differences:
- (10000 + 4900 + 1600) / 3 = 16500 / 3 = 5500
-
Square Root (RMSSD):
- √5500 ≈ 74.16 ms
This relatively high RMSSD value reflects strong parasympathetic influence, consistent with a calm state.
3. Frequency-Domain HRV Analysis
While time-domain methods look at statistics, frequency-domain analysis treats the sequence of R-R intervals as a signal and decomposes it into its underlying frequency components. This approach taps directly into your ECE background in signal processing. The goal is to see how much power is contained in different frequency bands, as these bands are linked to different physiological processes.
A Quick Refresher: From FFT to Power Spectrum
To perform frequency-domain analysis, we typically use the Fast Fourier Transform (FFT) to compute the signal's Power Spectral Density (PSD). The PSD shows how the signal's power is distributed across different frequencies.
Understanding Power Spectral Density and the Power Spectrum
The concept of a power spectrum is fundamental. Let's watch a brief refresher from MATLAB's channel. This will clarify how we get from a time-series signal (like our R-R intervals) to a meaningful power spectrum.
Watch the segment from 06:50 to 09:07 to see how an FFT is converted to a power spectrum. Then, watch 14:58 to 19:32, which explains the concept of Power Spectral Density (PSD) and why it's appropriate for signals like HRV. Finally, the summary from 19:32 to 20:13 provides a great wrap-up.
HRV Frequency Bands
The HRV power spectrum is typically divided into three main bands:
-
High Frequency (HF) band (0.15 – 0.4 Hz): This band corresponds to the frequency of normal breathing (9-24 breaths/minute). It is driven by a phenomenon called Respiratory Sinus Arrhythmia (RSA), where the heart rate speeds up during inhalation and slows down during exhalation. This process is mediated entirely by the vagus nerve. Therefore, HF power is considered a pure marker of parasympathetic (vagal) activity, much like RMSSD.
-
Low Frequency (LF) band (0.04 – 0.15 Hz): The physiological meaning of this band is more complex and debated. It is influenced by both the sympathetic and parasympathetic systems and is strongly associated with the baroreflex—the body's mechanism for regulating blood pressure.
-
Very Low Frequency (VLF) band (0.0033 – 0.04 Hz): The origin of this band is the least understood, but it is thought to be related to long-term regulatory mechanisms, including hormones and thermoregulation.
For practical purposes, especially in short-term recordings relevant to your startup, HF power is the most important frequency-domain metric.
The LF/HF Ratio
You will often encounter the LF/HF ratio, which was once widely promoted as a measure of "sympatho-vagal balance." The idea was that a high ratio indicated sympathetic dominance and a low ratio indicated parasympathetic dominance.
However, as the research paper "A focus on the assessment of the autonomic function..." notes, this interpretation is now considered overly simplistic and often misleading. The LF band is not a pure sympathetic marker. For your exams and practical work, it is important to know what the ratio is but also to be aware of the controversy surrounding its interpretation. Focus on RMSSD and HF power as your primary, reliable markers of vagal tone.
A focus on the assessment of the autonomic function using ...
To solidify these concepts, let's turn to a formal review article. This paper provides excellent descriptions of the frequency bands and the controversy around the LF/HF ratio.
Please read the section titled 'FREQUENCY-DOMAIN ANALYSIS'. Pay close attention to the descriptions of the High Frequency (HF) and Low Frequency (LF) bands, and especially the discussion on the LF/HF ratio.
Conclusion: Interpreting HRV for Autonomic Function
You now have a toolkit to quantify HRV using both time-domain and frequency-domain methods. For your work at Neuraease, these parameters are direct inputs for models aiming to assess stress, arousal, and cognitive load.
Key Takeaways:
- HRV measures the variation in R-R intervals, reflecting the adaptability of the heart and the balance of the autonomic nervous system.
- High HRV is generally associated with good health, fitness, and parasympathetic dominance (a "rest and digest" state).
- Low HRV is associated with stress, illness, and sympathetic dominance (a "fight or flight" state).
- Time-Domain: RMSSD is the most important short-term metric, providing a robust measure of parasympathetic (vagal) activity.
- Frequency-Domain: HF power is the most important spectral metric, also reflecting parasympathetic activity linked to respiration.
- A drop in RMSSD and/or HF power can be a powerful, quantitative indicator of rising physiological stress.
Preview of the Next Lesson:
We've now examined two key indicators of autonomic nervous system function: EDA for the sympathetic branch and HRV for the balance between both branches. In the next lesson, we will move to another signal highly relevant to your startup's focus on neurodivergence: Electrooculography (EOG). We will learn how to measure eye movements, which are not only critical for understanding visual attention but can also serve as a proxy for cognitive states and even detect specific artifacts in EEG data.
Can't find a good explanation? Sign up and we'll make it for you
Sign up