
Hello! Welcome to the next lesson in our "Observability & Monitoring" module.
In our last session, we successfully instrumented our Spring Boot application using Micrometer, turning it into a rich source of metrics. We configured counters, gauges, and timers, and exposed them at the /actuator/prometheus endpoint. However, this data is currently passive, waiting to be collected.
Today, we bring that data to life. Our goal is to set up Prometheus to scrape those metrics and write basic PromQL queries to analyze them. We will close the loop from metric generation to collection and analysis. This is a core competency for anyone managing production microservices and a frequent topic in system design and operational excellence interviews at companies like FAANG and Paypal.
1. Prometheus: The Pull-Based Collector
As we've touched on, Prometheus is an open-source monitoring system that excels at handling time-series data. One of its defining architectural features is its pull-based model.
Instead of applications needing to know where the monitoring system is and actively pushing data to it, Prometheus takes on the responsibility of periodically fetching, or "scraping," metrics from configured target endpoints.
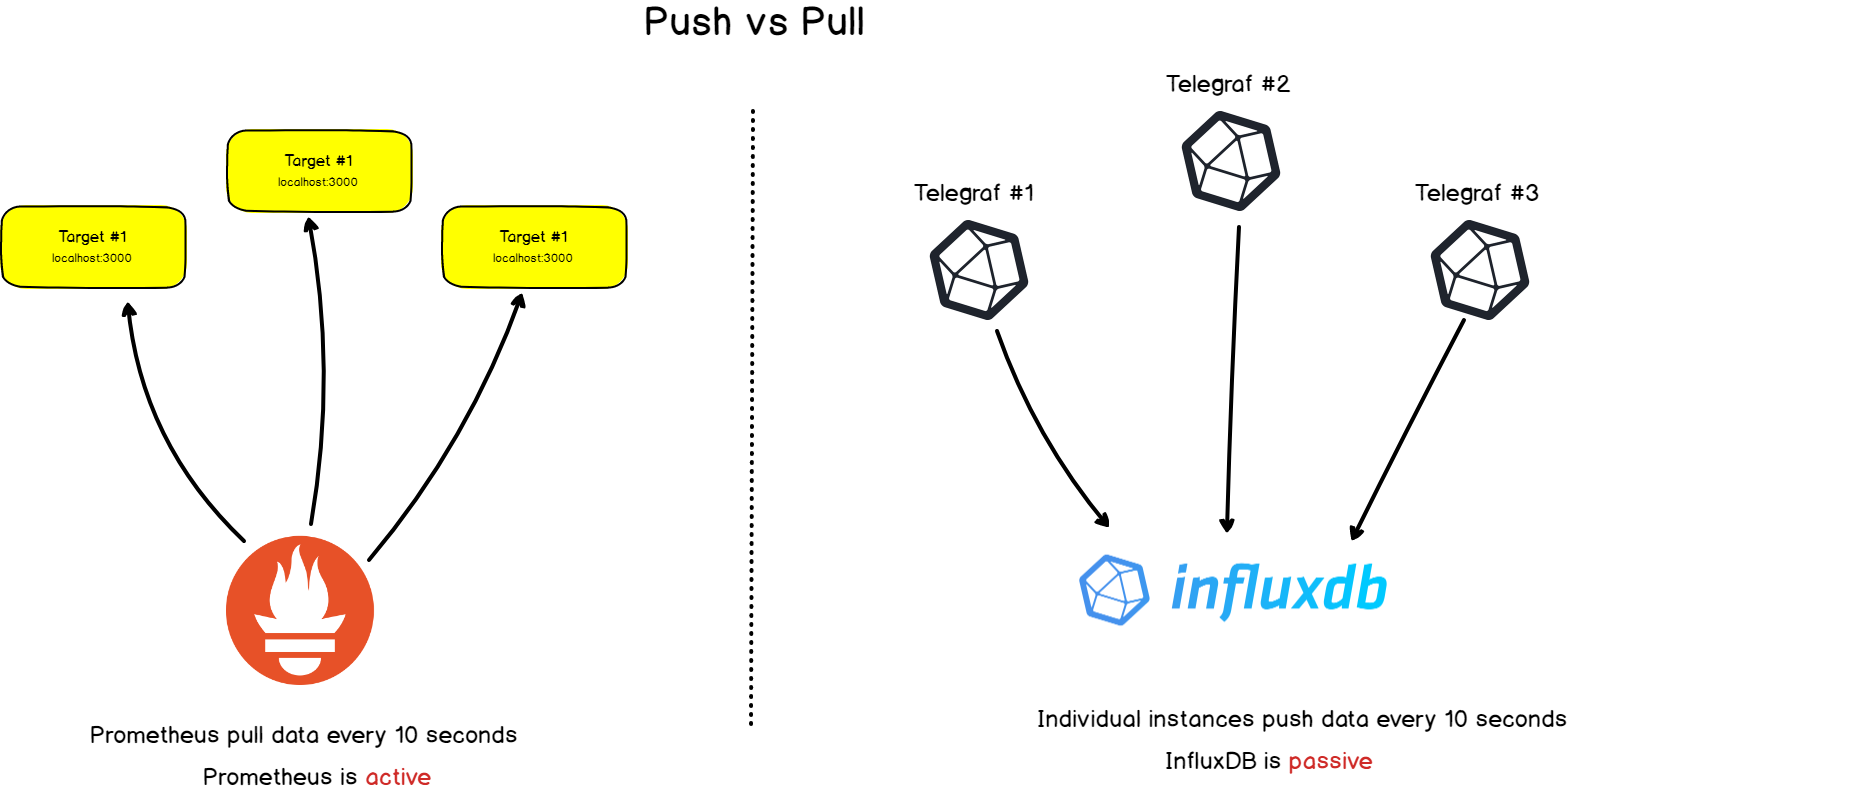
This design offers several advantages relevant to microservices:
- Decoupling: Your application doesn't need to know the address of the Prometheus server or handle the logic for retries if the server is down.
- Centralized Control: You manage which services are monitored and how frequently from a central Prometheus configuration.
- Service Discovery: Prometheus can dynamically discover targets, which is essential in ephemeral environments like Kubernetes where services come and go.
Let's begin by installing Prometheus and telling it where to find the metrics from our Spring Boot application.
How to generate Prometheus metrics from Spring Boot with Micrometer
The following article gives a quick introduction to Prometheus and why its pull-based model is beneficial. It solidifies the concepts we just discussed.
Please read the sections 'Introducing Prometheus', 'Publishing metrics in Spring Boot 2.x: with Micrometer', and 'Adding Prometheus to Spring Boot'. These sections provide a concise review of what we've covered and set the stage for the next step: configuring Prometheus itself.
2. Configuring and Running Prometheus
Prometheus is configured using a YAML file, typically named prometheus.yml. This file tells Prometheus which endpoints (targets) to scrape.
The prometheus.yml Configuration
Here is a minimal prometheus.yml file to scrape the Spring Boot application you instrumented in the last lesson. Create this file on your local machine.
# prometheus.yml

global:
  scrape_interval: 15s # By default, scrape every 15 seconds.

scrape_configs:
  # The job name is a label added to any timeseries scraped from this config.
  - job_name: 'spring-boot-app'

    # The path on the target where Prometheus can find the metrics.
    metrics_path: '/actuator/prometheus'

    # How often to scrape this specific job.
    scrape_interval: 5s

    # A static list of targets to scrape.
    static_configs:
      - targets: ['host.docker.internal:8080']
A crucial note on targets:
- The value
'host.docker.internal:8080'is a special DNS name that allows a Docker container (where we'll run Prometheus) to connect to a service running on the host machine (your Spring Boot app). - If you are running on Linux,
host.docker.internalmight not be available. A common alternative is to run the Docker container with--network="host"and use'localhost:8080'as the target. We'll see this in the command below.
Running Prometheus with Docker
The easiest way to run Prometheus is with Docker. Make sure your Spring Boot application from the previous lesson is running. Then, open a terminal in the directory where you saved prometheus.yml and run the following command:
docker run --rm \
  --name prometheus \
  -p 9090:9090 \
  -v ./prometheus.yml:/etc/prometheus/prometheus.yml \
  --add-host=host.docker.internal:host-gateway \
  prom/prometheus
Let's break down this command:
-p 9090:9090: Maps port 9090 from the container to your local machine, allowing you to access the Prometheus UI.-v ./prometheus.yml:/etc/prometheus/prometheus.yml: Mounts your localprometheus.ymlfile into the container at the location where Prometheus expects to find it.--add-host=host.docker.internal:host-gateway: This is the magic that makeshost.docker.internalwork on recent versions of Docker for Mac, Windows, and Linux.
After running this, Prometheus should be up and running!
How to generate Prometheus metrics from Spring Boot with Micrometer
This section of the article walks through the exact process we just discussed: creating the configuration file and launching Prometheus in a container. It provides a great visual confirmation of the steps.
Read the section 'Getting metrics into Prometheus'. Pay close attention to the sample prometheus.yml and the command for running Prometheus. The article uses Podman and a slightly different networking flag (--net=host), which is a common alternative, especially on Linux, as we noted.
3. Verifying the Scrape Target
With Prometheus running, the first thing to do is verify that it has successfully connected to your application.
- Open your web browser and navigate to
http://localhost:9090. - Click on Status > Targets in the top navigation bar.
You should see your spring-boot-app job listed. If everything is correct, the "State" of your endpoint will be UP with a green background. This confirms that Prometheus is successfully scraping metrics from your application. If the state is DOWN, check the Error column for clues. Common issues include firewall problems, incorrect target addresses, or your Spring Boot app not running.
4. Introduction to PromQL
Now that we are collecting data, we can start to query it using PromQL (Prometheus Query Language). This is how you explore data, build dashboards, and define alerts.
Navigate to the Graph tab from the main Prometheus UI. This is where you can execute PromQL queries.
A time series in Prometheus consists of a metric name and a set of key-value pairs called labels. This should feel very familiar from our last lesson on Micrometer tags!
metric_name{label1="value1", label2="value2"}
Let's start with a simple query. In the expression input bar, type process_cpu_usage and click Execute. Prometheus will display a graph of your application's CPU usage over time.

Filtering with Labels
The real power comes from using labels. Let's look at the HTTP request timer that Micrometer provides out of the box. Try this query:
http_server_requests_seconds_count
This will show you the total count of HTTP requests, broken down by various labels like method, status, and uri. To see only the requests for a specific URI, you can filter by the uri label:
http_server_requests_seconds_count{uri="/your-api-endpoint"}
5. Essential PromQL Functions for Interviews
Simply viewing raw metrics is not enough. In a production scenario or an interview, you'll be expected to calculate rates, percentages, and aggregations.
rate(): The Most Important Function
Counters, like http_server_requests_seconds_count, only ever increase. This is not very useful for seeing current throughput. The rate() function calculates the per-second average rate of increase of a counter over a specified time window.
For example, to find the number of requests per second over the last 5 minutes for your entire application, you would use:
rate(http_server_requests_seconds_count[5m])
The [5m] part is a range vector selector, which tells Prometheus to look at the last 5 minutes of data for each data point in the graph.
sum() and other Aggregators
The previous query will likely return many lines—one for each unique combination of labels. To get a single value representing the total requests per second across the whole service, you can use sum():
sum(rate(http_server_requests_seconds_count[5m]))
You can also use sum() with a by() clause to aggregate while preserving specific labels. This is extremely powerful. For example, to get the requests per second for each URI:
sum by (uri) (rate(http_server_requests_seconds_count[5m]))
Other useful aggregators include avg() (average), min() (minimum), max() (maximum), and count().
Custom micrometer metrics in Spring Boot...
The following article provides a list of practical PromQL queries that you can use with the default metrics from a Spring Boot application. While the article's end goal is building a Grafana dashboard, the queries themselves are pure PromQL and are excellent examples to try in the Prometheus UI.
Review the list of PromQL queries in section '6 Set up a Grafana dashboard...'. Try running some of them in your Prometheus UI, such as the queries for 'Uptime', 'Heap utilization', and 'CPU utilization'. This is a great way to get hands-on with real-world queries.
Test your understanding!
In the last lesson, we discussed instrumenting payment gateway calls with a metric like payment_gateway_calls_total{status="success"} or payment_gateway_calls_total{status="failure"}.
How would you write a PromQL query to calculate the error rate percentage for this payment gateway over the last 10 minutes?
Show answer
Here is the PromQL query:
(sum(rate(payment_gateway_calls_total{status="failure"}[10m])) / sum(rate(payment_gateway_calls_total[10m]))) * 100
Let's break this down:
sum(rate(payment_gateway_calls_total{status="failure"}[10m])): Calculates the per-second rate of failed calls over the last 10 minutes.sum(rate(payment_gateway_calls_total[10m])): Calculates the total per-second rate of all calls (both success and failure) over the same period.- Dividing the two gives us the ratio of errors to total calls.
- Multiplying by 100 converts this ratio into a percentage.
This is a classic and very common query pattern used for calculating error rates.
Conclusion
Congratulations! You have now completed the entire observability loop for metrics. You started by instrumenting an application, and in this lesson, you set up a monitoring system to collect that data and learned how to query it to extract meaningful insights.
Key Takeaways:
- Prometheus uses a pull-based model to scrape metrics from configured targets.
- Configuration is done via
prometheus.yml, where you define scrape jobs and targets. - The Prometheus UI (Status > Targets) is the first place to check if your scraping configuration is working.
- PromQL is a powerful language for querying time-series data.
- The
rate()function is essential for understanding the throughput of counters. - Aggregation operators like
sum by (...)are critical for turning high-cardinality data into understandable information.
Next Up
Having data and being able to query it is powerful, but staring at graphs all day isn't scalable. How do we get notified automatically when something is wrong? In our next lesson, we will build upon our PromQL knowledge to Define Service Level Indicators (SLIs), Objectives (SLOs), and implement alerting rules in Prometheus. This moves us from passive monitoring to proactive alerting, a cornerstone of reliable system operations.
Can't find a good explanation? Sign up and we'll make it for you
Sign up