
Hello! Welcome to the final lesson in our module on Observability & Monitoring.
In our last lesson, we learned how to define SLOs and set up Prometheus alerts based on our error budget. This gives us a powerful way to know when our service's reliability is degrading. Now, an alert has fired, and you've been paged. You know what is wrong (e.g., latency is high or the error rate has spiked), but you don't know why. Is it a slow database query? A dependency on another service? A bottleneck in your own code?
This is where distributed tracing comes in. Today's lesson will equip you with the skills to answer those "why" questions. For your goal of excelling in senior-level interviews, being able to articulate how you would diagnose a production issue is non-negotiable. Moving from "I see the problem in the dashboard" to "I have pinpointed the root cause" is a critical step.
Our learning outcome is to interpret distributed traces in Zipkin to identify and diagnose performance bottlenecks in a request flow. We'll learn how to read trace visualizations to understand the life of a request as it travels through our microservices ecosystem.
1. The Anatomy of a Distributed Trace
Before we jump into the tools, let's understand the core concepts. Distributed tracing follows a request from the moment it enters your system until the final response is sent, tracking its journey across service boundaries.
This is built on three key ideas:
- Trace: A trace represents the entire end-to-end journey of a single request. It is identified by a unique Trace ID. Think of this as the master tracking number for a package.
- Span: A span represents a single, named, timed operation within a trace. This could be an HTTP request, a database query, or a method execution. Each span has its own Span ID and also references its parent span's ID. Spans within a trace form a parent-child hierarchy, creating a tree-like structure that shows causality.
- Trace Context: This is the metadata (including the Trace ID and current Span ID) that is passed from one service to another with each request. This is typically done via HTTP headers (e.g.,
traceparent). This context propagation is what allows a tracing system to stitch together individual spans from different services into a single, cohesive trace.
Your Spring Boot application, when configured correctly, handles this automatically. Micrometer Tracing instruments your code to create spans, and libraries for Feign, RestTemplate, or WebClient automatically add the necessary headers to propagate the trace context.
Microservice Advance: Distributed Tracing using Zipkin ...
The following resource, 'Microservice Advance: Distributed Tracing using Zipkin ...', provides a good overview of how Zipkin and Micrometer work together. We won't re-do the full setup, but it's useful to see the key components.
First, read the 'Introduction' and 'Real-Time Analogy' sections for a high-level overview. Then, review the section 'Checking Traces by Adding Micrometer to a Spring Boot 3 Application' to see the key dependencies and configuration properties. Focus on understanding the roles of micrometer-tracing-bridge-brave, zipkin-reporter-brave, and the management.tracing.sampling.probability property.
As you read, the key takeaway is that with a few dependencies and properties, Spring Boot can automatically:
- Generate trace and span IDs for incoming requests.
- Propagate these IDs on outgoing requests (e.g., via Feign clients).
- Send this trace data to a collector like Zipkin.
The property management.tracing.sampling.probability controls what fraction of requests are traced. For development and this lesson, 1.0 (100%) is fine. In a high-volume production environment, you would use a smaller fraction (e.g., 0.1 for 10%) to reduce the performance overhead and storage costs of tracing.
2. Reading the Tea Leaves: Interpreting Traces in Zipkin
Once traces are collected, Zipkin provides a UI to search for and visualize them. This visualization is the key to diagnostics. Let's learn how to read it.
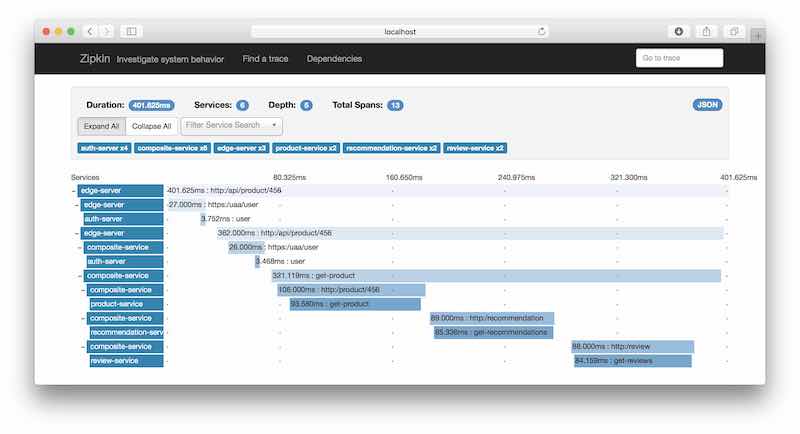
When you open a trace in Zipkin, you'll see a few key things:
- Trace Summary: At the top, you'll see the total duration of the request, the number of services involved, and the total number of spans.
- Timeline (Gantt Chart): This is the heart of the UI.
- Time flows from left to right.
- Each horizontal bar is a span. The length of the bar is its duration.
- The vertical arrangement and indentation show the parent-child relationships. A span that starts after its parent and is indented is a child span, meaning it was called by the parent.
- You can see which service performed each operation.
- Span Details: Clicking on any span reveals its tags (key-value annotations like
http.method,http.status_code,sql.query) and any logs recorded during that operation. These details are crucial for getting to the root cause.
Now, let's turn this into a diagnostic process.
3. A Systematic Approach to Diagnosing Bottlenecks
When you're looking at a trace because of a latency alert, your goal is to find out where the time went. A slow request is almost always caused by one or more long spans.
Bottleneck Identification Using Distributed Tracing
The article 'Bottleneck Identification Using Distributed Tracing' provides an excellent, structured framework for analyzing trace data. We will use its principles to guide our diagnostic process.
Please read the section 'Reading Trace Graphs'. Pay close attention to the table that lists indicators like 'Span Duration', 'Error Spans', and 'Parallel Operations'. This gives you a mental checklist for what to look for.
Let's apply these principles to identify common performance anti-patterns.
Pattern 1: The Dominating Span
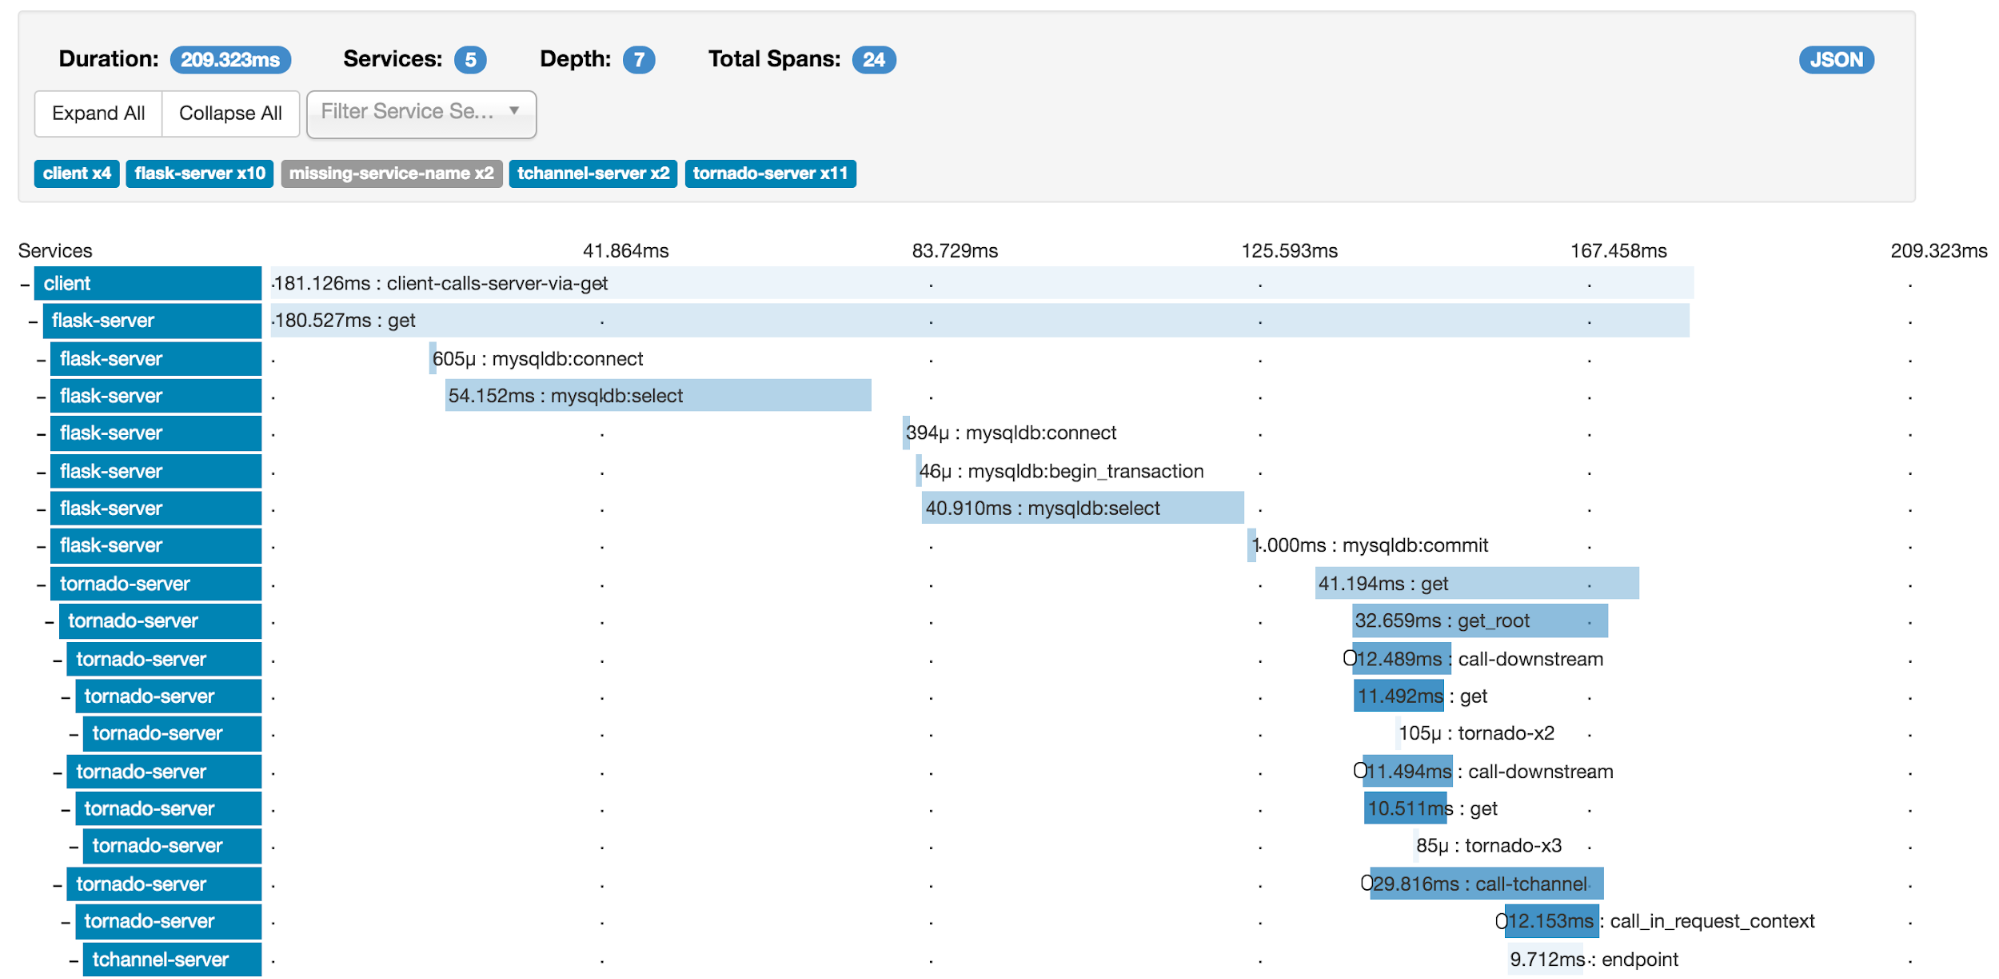
This is the most common and easiest bottleneck to spot. It's a single span whose duration accounts for the vast majority of the total request time.
How to Identify:
- Look for the longest bar in the Gantt chart.
- Check its duration relative to the total trace duration.
What to do:
- Click the long span to view its details and tags.
- If it's a database query (
sql.querytag), the query itself is likely inefficient. Your next step is to copy the query and run anEXPLAINorANALYZEplan in the database to understand why it's slow (e.g., missing index, full table scan). - If it's an HTTP call to another service, the problem lies within that downstream service. You would then find a trace for that service's internal processing to continue the investigation there.
Pattern 2: The Sequential Chain (The "Waterfall")
This pattern occurs when a service makes a series of blocking, sequential calls to other services. The total latency is the sum of all these individual calls.
How to Identify:
- In the timeline, you'll see a "staircase" or "waterfall" pattern of spans, where one call finishes completely before the next one begins.
- Look at the LINK image again. The
composite-servicecallsproduct-service, thenrecommendation-service, thenreview-serviceone after another.
What to do:
- Ask the question: "Are these calls truly dependent on each other?"
- In the
composite-serviceexample, it's likely that getting product details, recommendations, and reviews are all independent operations. - If they are independent, they can be parallelized. In Java, you could use
CompletableFuture.allOf()or, if using a reactive stack,Flux.zip()orMono.zip()to execute these calls concurrently. This can drastically reduce the total latency fromT1 + T2 + T3tomax(T1, T2, T3). - Recognizing this pattern in an interview and suggesting parallelization is a strong sign of a senior engineer.
Pattern 3: The "Gap" (Hidden Latency)
Sometimes the spans themselves are fast, but there are large time gaps between them.
How to Identify:
- You'll see empty space on the timeline within a parent span, after one child span finishes and before the next one starts.
What this means:
- The application is spending time doing work on the CPU that isn't instrumented with a span. This could be complex business logic, data transformation (JSON serialization/deserialization), or waiting for a resource like a thread from a thread pool.
What to do:
- This tells you that you need more detailed instrumentation.
- You can add custom spans around specific methods in your code using Micrometer's
TracerAPI or the@NewSpanannotation to make this hidden work visible. This allows you to narrow down the source of the in-process latency.
Test your understanding!
You are investigating a slow API endpoint, /api/v1/orders/12345, which took 950ms. You find the following trace in Zipkin:
| Service | Span Name | Duration | Parent |
|---|---|---|---|
| api-gateway | GET /api/v1/orders/12345 | 950ms | (root) |
| order-service | GET /orders/12345 | 945ms | api-gateway |
| order-service | GET user-service/users/abc | 80ms | order-service |
| order-service | GET inventory-service/products/xyz | 850ms | order-service |
| inventory-service | GET /products/xyz | 840ms | order-service |
| inventory-service | DB: SELECT * FROM stock WHERE... | 820ms | inventory-service |
- Which service and operation is the primary bottleneck?
- What is the most likely cause of the bottleneck?
- What would be your immediate next step to confirm your hypothesis?
Show answer
- The primary bottleneck is in the inventory-service, specifically the call to the database (
DB: SELECT * FROM stock WHERE...), which took 820ms out of the total 950ms. - The most likely cause is an inefficient database query. The application is spending almost all its time waiting for the database to return data.
- The immediate next step would be to examine the tags of the database span in Zipkin to get the exact
sql.querythat was executed. Then, I would connect to the database and run anEXPLAIN ANALYZEon that query to see its execution plan and identify why it's slow (e.g., it's missing an index, performing a full table scan, or doing a costly join).
4. Beyond Traces: Correlating with Metrics and Logs
Distributed tracing is incredibly powerful, but it doesn't exist in a vacuum. To get a complete picture, you must correlate what you see in a trace with other observability signals.
Bottleneck Identification Using Distributed Tracing
The 'Bottleneck Identification' article also touches on this crucial point. To truly understand a problem, you need to combine signals.
Read the section 'Combining Traces with System Data'. This will connect what we are learning today with the metrics and logging we have discussed in previous lessons.
Imagine our scenario from the exercise: you've found a slow 820ms database query.
- Trace tells you where the latency is (a specific query).
- Metrics (from Prometheus) tell you about the health of the resource. You would check the database dashboard for the time of the incident. Is the database CPU pegged at 100%? Is it running out of memory? Are disk I/O wait times high? This tells you if the database itself is overloaded.
- Logs tell you the fine-grained application context. Because your logs include the Trace ID, you can filter the logs for that specific request and see any application-level warnings, error messages, or contextual information that occurred during that exact transaction.
In an interview, describing this holistic approach—using traces to locate the problem, metrics to assess resource health, and logs for deep context—demonstrates a mature understanding of production troubleshooting.
Conclusion
You have now completed your journey through the three pillars of observability: logs, metrics, and traces. You understand how to use them together to build resilient, understandable, and debuggable systems.
Key Takeaways:
- Distributed tracing provides end-to-end visibility of a request's journey across microservices.
- A trace is a full journey, and a span is a single operation. The Zipkin UI visualizes these as a Gantt chart.
- To diagnose latency, look for common anti-patterns: long, dominating spans (often a slow query or I/O), and sequential waterfalls of calls that could be parallelized.
- Don't forget to look for gaps between spans, which indicate un-instrumented code that may require custom spans to diagnose further.
- The most effective troubleshooting uses all three signals: traces to pinpoint where the problem is, metrics to understand the health of the system resources, and logs to get detailed, request-specific context.
Next Up
With a robust observability stack in place, we can confidently monitor our applications in production. But how do we prevent bugs from getting there in the first place? Our next module, Testing Strategies for Microservices, shifts our focus to building quality in from the very beginning. In the first lesson, we will lay the foundation by learning how to implement unit tests for a Spring Boot microservice using JUnit and Mockito to isolate component behavior.
Can't find a good explanation? Sign up and we'll make it for you
Sign up