
Hello! Welcome back to our module on Observability & Monitoring.
In our last lesson, we implemented dynamic configuration refresh with Spring Cloud Bus, which was a crucial step in managing our microservices without downtime. We solved the problem of controlling a distributed system. Today, we tackle the equally important challenge of observing it. When you have dozens of services, a single user request can trigger a complex chain of events. If something goes wrong, how do you find the needle in the haystack?
This lesson addresses that question directly. Our learning outcome is to implement structured logging with correlation IDs for end-to-end request troubleshooting. We will transform our chaotic, disconnected log streams into a coherent, searchable narrative that allows us to trace a single operation from the moment it enters our system until it leaves. This is a foundational practice for building production-ready applications and a common topic in senior-level interviews.
1. The Problem: "Log Chaos" in Microservices
In a monolithic application, troubleshooting is relatively straightforward. Logs are in one place, and you can typically follow a request's execution by reading them chronologically. In a microservices architecture, this breaks down completely. A single user action might involve calls to a gateway, an authentication service, an order service, and a notification service. Each service generates its own logs, resulting in a mess of interleaved, unrelated log entries.
The core problem is the lack of a common identifier to tie all these log entries together. This is where correlation IDs come in.
Correlation IDs in Spring Boot
To grasp the fundamentals of why this is such a critical problem and how correlation IDs provide the solution, let's start with an article by Alexander Obregon.
Please read the first two sections, 'Mechanics of Correlation IDs' and 'How Correlation IDs Travel Between Services'. Focus on understanding what a correlation ID is and the basic mechanism for propagating it via HTTP headers.
As the article explains, a correlation ID is a unique identifier assigned to a request when it first enters the system. This ID is then passed along with the request through every service it touches. By ensuring every log statement related to that request includes this ID, you can filter your logs to see the complete, end-to-end journey of that single operation.
2. The Magic Ingredient: Mapped Diagnostic Context (MDC)
You might be wondering if you have to manually pass this correlation ID to every single log statement in your code. Fortunately, you don't. Modern logging frameworks provide a mechanism called the Mapped Diagnostic Context (MDC).
The MDC is essentially a thread-local Map<String, String>. You can put contextual information, like a correlation ID, into the MDC at the beginning of a request's lifecycle. Then, you configure your logging framework (like Logback) to automatically retrieve and print that information with every log message generated on that thread.
The flow is simple:
- A request comes in.
- We place the correlation ID into the MDC.
- All
log.info(),log.error(), etc., calls on that thread will automatically include the ID. - Crucially, when the request is finished, we must clear the MDC to prevent the ID from "leaking" onto another request that might reuse the same thread.
Correlation IDs in Spring Boot
The same article provides an excellent explanation of the MDC and how to set it up.
Now, please read the sections 'Logging Frameworks and Correlation IDs' and 'Setting Up MDC in a Filter Example'. Pay close attention to the role of the try...finally block, which is essential for ensuring the MDC is cleaned up properly.
3. Implementation: Capturing and Managing the Correlation ID
Based on what we've just learned, the first step is to create a Filter that intercepts all incoming requests. This filter is our gatekeeper for correlation IDs.
Here is a robust implementation of such a filter.
CorrelationIdFilter.java
import jakarta.servlet.*;
import jakarta.servlet.http.HttpServletRequest;
import jakarta.servlet.http.HttpServletResponse;
import org.slf4j.MDC;
import org.springframework.stereotype.Component;
import java.io.IOException;
import java.util.UUID;

@Component
public class CorrelationIdFilter implements Filter {

    private static final String CORRELATION_ID_HEADER_NAME = "X-Correlation-ID";
    private static final String CORRELATION_ID_MDC_KEY = "correlationId";

    @Override
    public void doFilter(ServletRequest servletRequest, ServletResponse servletResponse, FilterChain filterChain)
            throws IOException, ServletException {

        HttpServletRequest request = (HttpServletRequest) servletRequest;
        HttpServletResponse response = (HttpServletResponse) servletResponse;

        // 1. Get correlation ID from header or generate a new one
        String correlationId = request.getHeader(CORRELATION_ID_HEADER_NAME);
        if (correlationId == null || correlationId.isEmpty()) {
            correlationId = UUID.randomUUID().toString();
        }

        // 2. Add to MDC for logging
        MDC.put(CORRELATION_ID_MDC_KEY, correlationId);

        // 3. Add to response header so client can see it
        response.setHeader(CORRELATION_ID_HEADER_NAME, correlationId);

        try {
            // Process the request
            filterChain.doFilter(request, response);
        } finally {
            // 4. CRITICAL: Clear MDC to prevent memory leaks and incorrect IDs
            MDC.remove(CORRELATION_ID_MDC_KEY);
        }
    }
}
This filter does four key things:
- It checks for an incoming
X-Correlation-IDheader. If one doesn't exist, it creates a new one. This ensures every request has an ID, whether it's the first service in the chain or a downstream one. - It puts the ID into the MDC.
- It sets the same ID on the response, which is useful for clients and for debugging.
- It uses a
try...finallyblock to guarantee that the MDC is cleared after the request is processed, even if an exception occurs.
4. Configuring Structured Logging with Logback
With the correlation ID in the MDC, we now need to tell our logger to use it. We'll also configure it to output logs in a structured JSON format, which is much easier for log aggregation systems (like the ELK stack, Splunk, or Datadog) to parse and index.
First, add the Logstash Logback encoder dependency to your pom.xml. This library provides excellent support for JSON logging.
<dependency>
    <groupId>net.logstash.logback</groupId>
    <artifactId>logstash-logback-encoder</artifactId>
    <version>7.4</version> <!-- Use a recent version -->
</dependency>
Next, create a logback-spring.xml file in your src/main/resources directory.
logback-spring.xml
<?xml version="1.0" encoding="UTF-8"?>
<configuration>
    <include resource="org/springframework/boot/logging/logback/defaults.xml"/>

    <springProperty scope="context" name="springAppName" source="spring.application.name"/>

    <!-- Console Appender for JSON formatted logs -->
    <appender name="jsonConsole" class="ch.qos.logback.core.ConsoleAppender">
        <encoder class="net.logstash.logback.encoder.LogstashEncoder">
            <includeMdcKeyName>correlationId</includeMdcKeyName>
        </encoder>
    </appender>

    <!-- Console Appender for human-readable logs during local development -->
    <appender name="plainConsole" class="ch.qos.logback.core.ConsoleAppender">
        <encoder>
            <pattern>%d{HH:mm:ss.SSS} [%thread] %-5level [${springAppName},%X{correlationId:-}] %logger{36} - %msg%n</pattern>
        </encoder>
    </appender>

    <root level="INFO">
        <!-- Use 'jsonConsole' for production/staging environments -->
        <!-- Use 'plainConsole' for local development -->
        <appender-ref ref="plainConsole" />
    </root>
</configuration>
This configuration sets up two log formats:
plainConsole: A traditional, human-readable format that includes the correlation ID (%X{correlationId:-}). The:-provides a blank default if the ID isn't present. This is great for local development.jsonConsole: This uses the Logstash encoder to produce structured JSON. The<includeMdcKeyName>correlationId</includeMdcKeyName>tag tells it to add our MDC value to the JSON object.
A log message like log.info("Processing order") would look like this in JSON:
{
  "@timestamp": "2023-10-27T10:30:00.123Z",
  "message": "Processing order",
  "correlationId": "f47ac10b-58cc-4372-a567-0e02b2c3d479",
  "level": "INFO",
  "thread_name": "http-nio-8080-exec-1",
  ...
}
This format is perfect for powerful, field-based searching in a central logging tool. For an interview, being able to discuss the benefits of structured JSON logging over plain text demonstrates a deep understanding of production operational needs.
5. Propagating the ID to Downstream Services
Our system is only half-complete. We've handled the incoming request, but if our service calls another service, we need to pass the correlation ID along. The following diagram illustrates this flow perfectly.
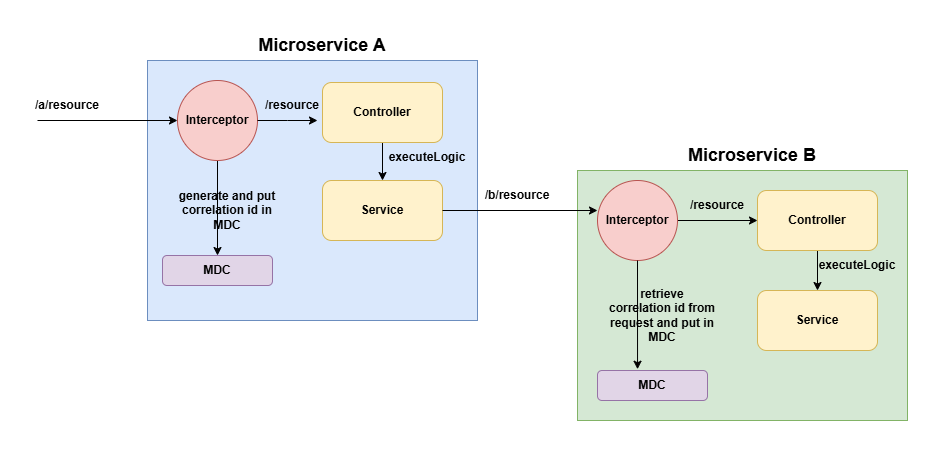
To implement this propagation, we use an interceptor on our HTTP client. If you are using RestTemplate, you can configure it with a ClientHttpRequestInterceptor.
import org.slf4j.MDC;
import org.springframework.http.HttpRequest;
import org.springframework.http.client.ClientHttpRequestExecution;
import org.springframework.http.client.ClientHttpRequestInterceptor;
import org.springframework.http.client.ClientHttpResponse;

import java.io.IOException;

public class CorrelationIdInterceptor implements ClientHttpRequestInterceptor {

    private static final String CORRELATION_ID_HEADER_NAME = "X-Correlation-ID";
    private static final String CORRELATION_ID_MDC_KEY = "correlationId";

    @Override
    public ClientHttpResponse intercept(HttpRequest request, byte[] body, ClientHttpRequestExecution execution) throws IOException {
        String correlationId = MDC.get(CORRELATION_ID_MDC_KEY);
        if (correlationId != null) {
            request.getHeaders().add(CORRELATION_ID_HEADER_NAME, correlationId);
        }
        return execution.execute(request, body);
    }
}
You would then add this interceptor when creating your RestTemplate bean:
@Bean
public RestTemplate restTemplate(RestTemplateBuilder builder) {
    return builder
            .additionalInterceptors(new CorrelationIdInterceptor())
            .build();
}
Now, every outgoing call made with this RestTemplate will automatically have the X-Correlation-ID header attached, completing the end-to-end chain.
Correlation IDs in Spring Boot
Propagating context is crucial, and it becomes more complex with asynchronous processing. The article we've been using has excellent examples for modern clients and async scenarios.
Please read the entire section 'Tracking Correlation IDs Across Distributed Systems'. Focus on the examples for WebClient (if you use reactive programming), RestTemplate, and especially the part on 'Correlation IDs In Asynchronous Processing'. The TaskDecorator example for handling @Async methods is a classic senior-level interview topic.
Test your understanding!
A developer on your team uses @Async to offload a long-running task to a separate thread pool. They report that log messages from this asynchronous method are missing the correlation ID. Why is this happening, and how would you advise them to fix it?
Show answer
This happens because the MDC is thread-local. When Spring creates a new thread from its thread pool to execute the @Async method, the MDC context from the original request thread is not automatically propagated to the new thread.
The solution is to configure a TaskDecorator for the ThreadPoolTaskExecutor. This decorator intercepts the task submission, copies the MDC context map from the parent thread, and sets it on the child thread before executing the task. The code provided in the 'Correlation IDs In Asynchronous Processing' section of the recommended article shows a perfect implementation of this pattern. By creating a TaskDecorator bean, Spring Boot's auto-configuration will apply it to the default async thread pool.
Conclusion
Congratulations! You've just implemented one of the most important observability patterns in a microservices architecture. By combining structured logging with correlation IDs, you've laid the groundwork for rapid, effective troubleshooting in a complex distributed environment.
Key Takeaways:
- Structured Logging (JSON): Makes logs machine-readable, enabling powerful search and analysis in tools like the ELK Stack or Splunk.
- Correlation ID: A unique identifier that follows a request across all service boundaries.
- SLF4J MDC: The thread-local mechanism used to hold the correlation ID so it can be automatically added to every log line without cluttering your business logic.
- Implementation Pattern:
- Use a
ServletFilterto capture/generate the ID for incoming requests and put it in the MDC. - Use a
ClientHttpRequestInterceptor(forRestTemplate) orExchangeFilterFunction(forWebClient) to propagate the ID to downstream services. - Always use a
try...finallyblock to clear the MDC after a request is handled. - Configure
logback-spring.xmlto read from the MDC (%X{key}) and format logs as JSON.
- Use a
Next Up
Correlation IDs are a massive step forward for log-based troubleshooting. However, you still have to manually search logs and piece the story together. What if you could see the entire request flow visualized as a timeline, with latency breakdowns for each service call?
In our next lesson, we will build directly on today's concepts to do just that. We will implement distributed tracing using Micrometer Tracing and Zipkin, an automated system that gives us rich, graphical insights into our request flows, helping us pinpoint bottlenecks and errors with even greater precision.
Can't find a good explanation? Sign up and we'll make it for you
Sign up